Turn a written model description into a clean neural network architecture diagram. Name the layers, tensor shapes, skip connections, and repeated blocks, and get a figure for papers, theses, posters, and slides.
CNN and transformer architecture diagramsTensor shapes and skip connectionsNo watermark
AI Neural Network Diagram Generator
Describe the layers, shapes, and connections in your model.
Costs 5 credits498 / 2000 characters
Generates a PNG architecture figure from your description.
Preview
Neural Network Diagram Examples
Target aspect ratio: 16:9
Sample previews. Describe your model to generate your own diagram.
Neural Network Architecture Diagram Examples
Hover a card to copy its prompt. Each example spells out layers, shapes, and connections so the figure matches the model.
Prompt
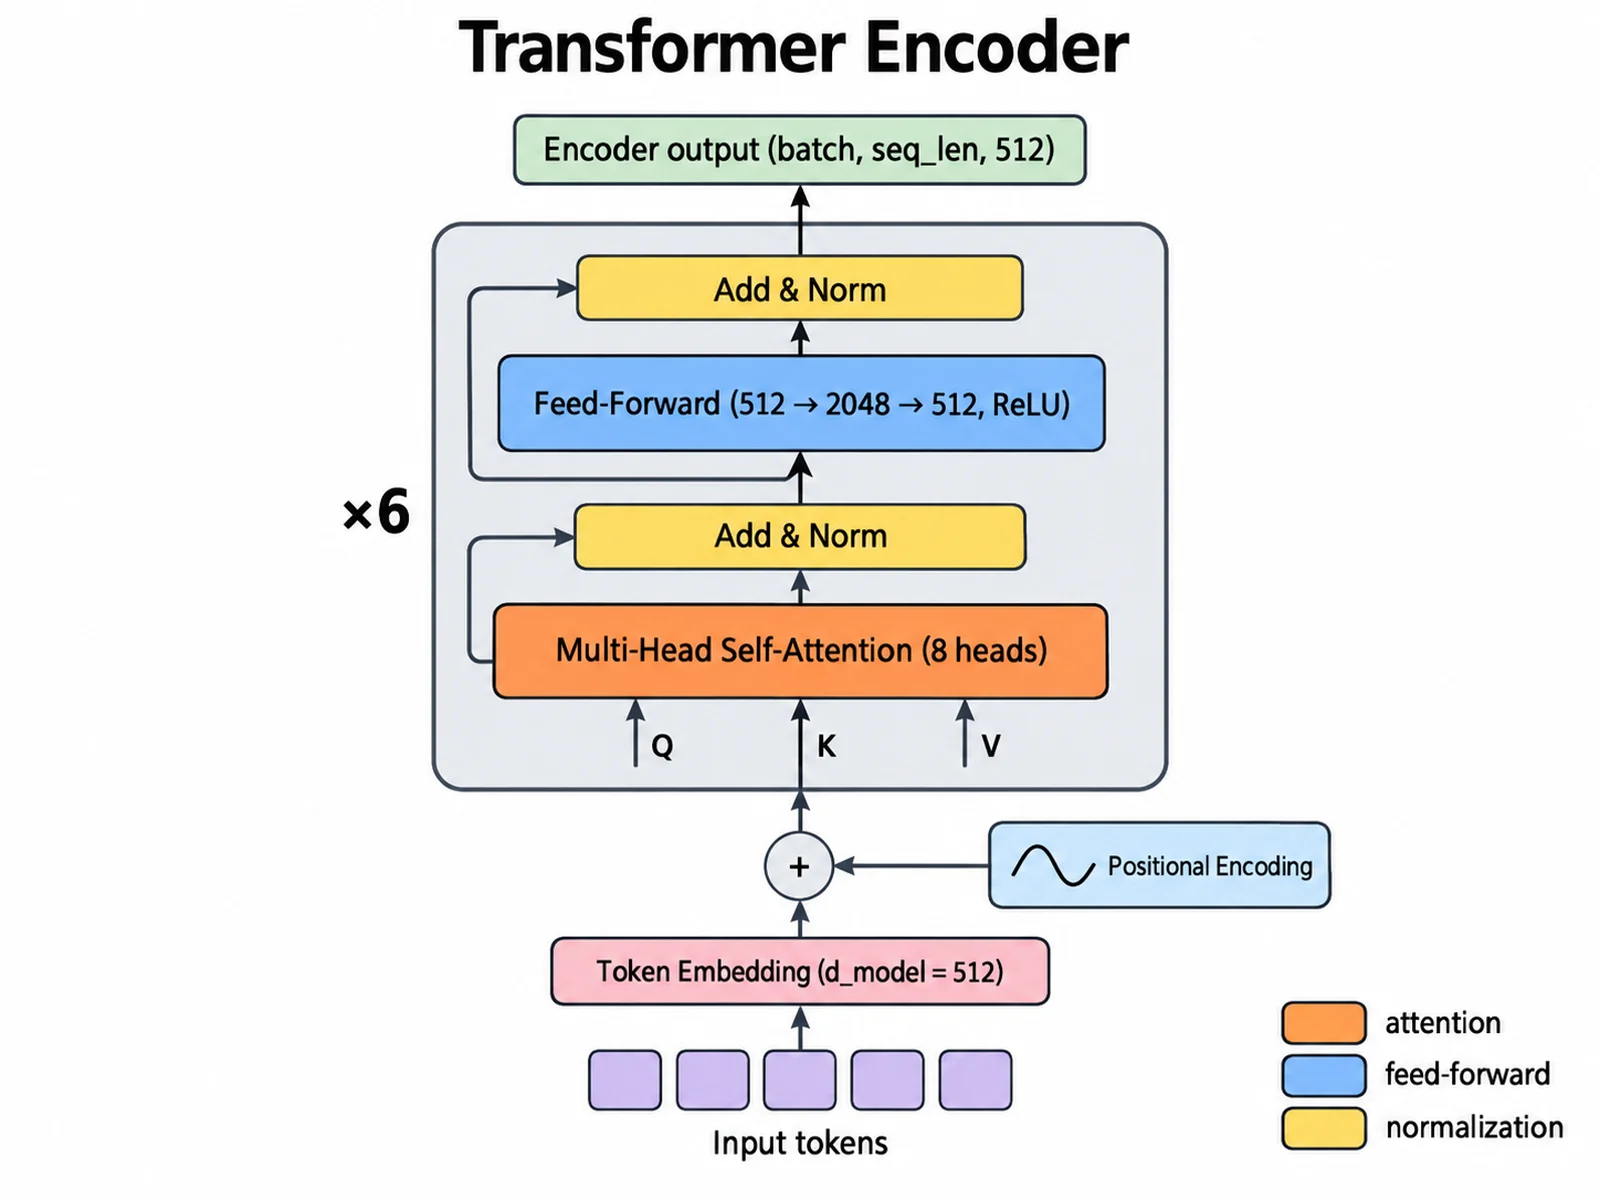
Create a transformer architecture diagram of the encoder, flowing bottom to top. Input tokens → token embedding (d_model = 512) plus sinusoidal positional encoding. Then one encoder layer inside a rounded outline labeled "×6": multi-head self-attention (8 heads) → Add & Norm → position-wise feed-forward (512 → 2048 → 512, ReLU) → Add & Norm. Draw a residual arrow around each sublayer into its Add & Norm. Output label: "Encoder output (batch, seq_len, 512)". Color attention orange, feed-forward blue, normalization yellow. White background, clean journal style.
Transformer Encoder Architecture
Prompt
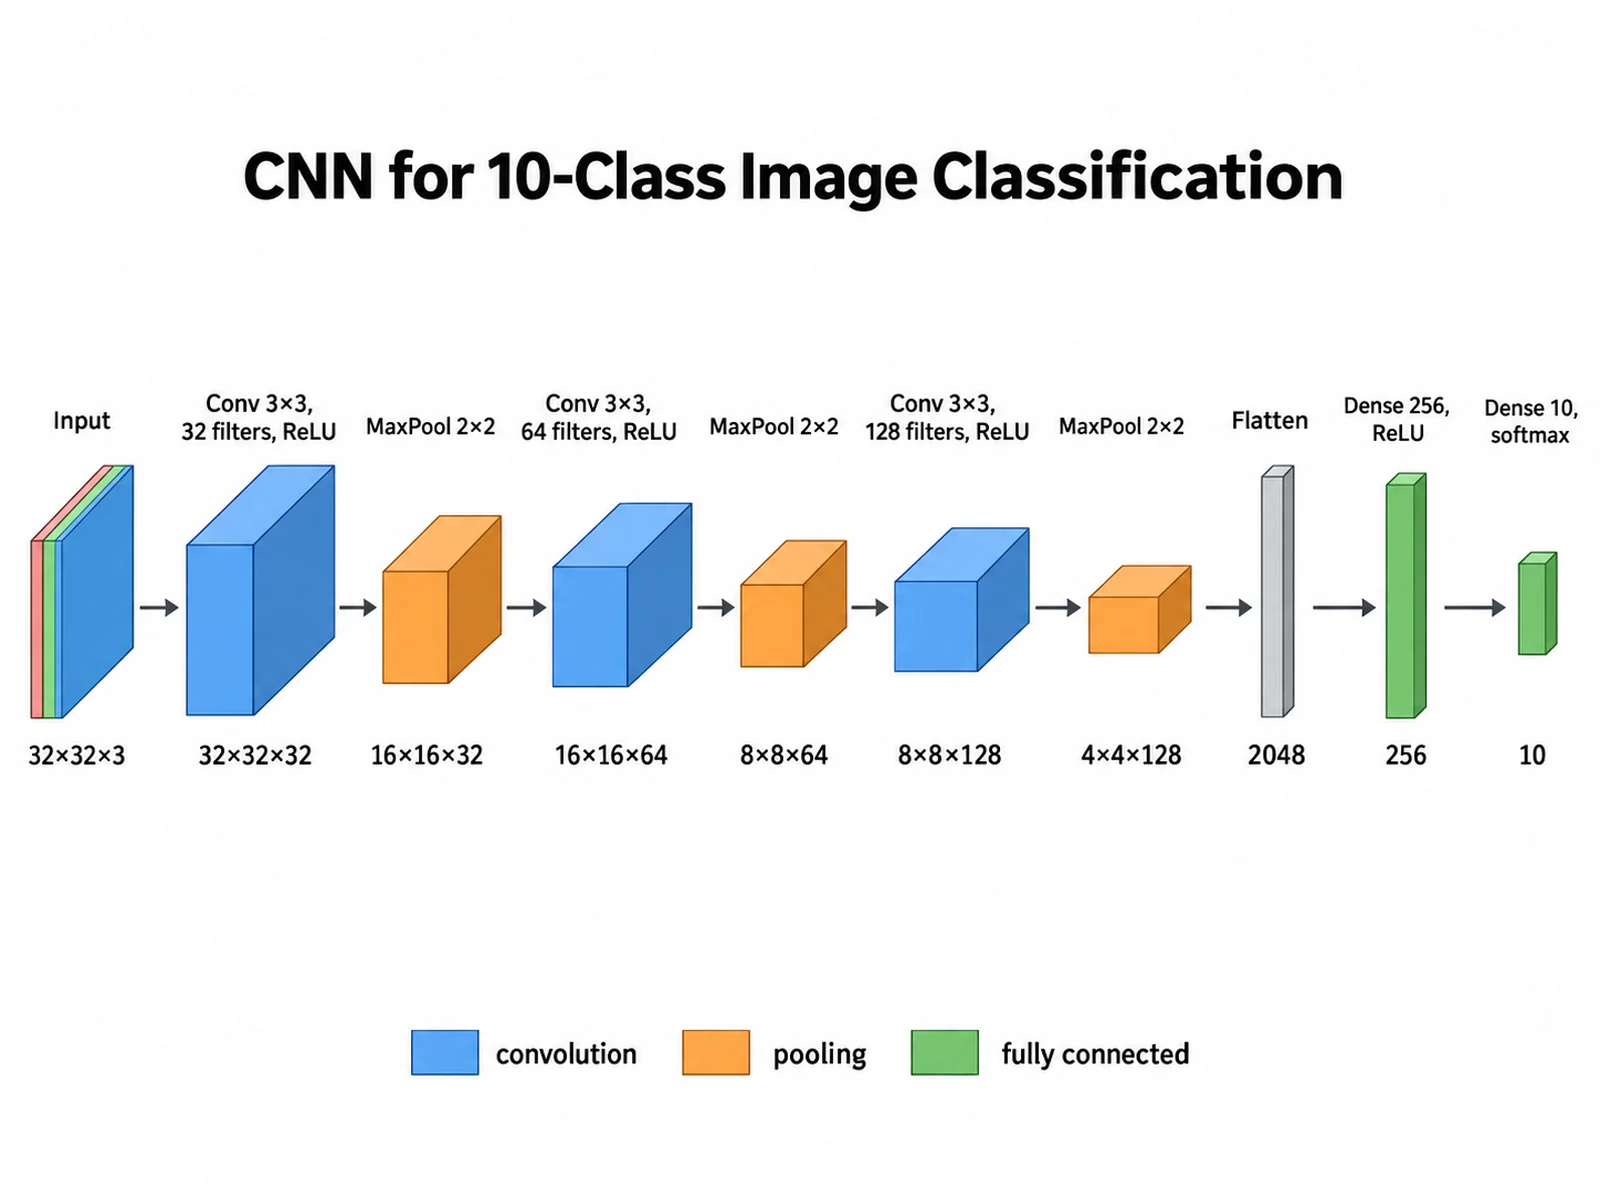
Create a CNN architecture diagram for 10-class image classification, flowing left to right as 3D blocks. Input 32×32×3 → Conv 3×3, 32 filters, ReLU → 32×32×32 → MaxPool 2×2 → 16×16×32 → Conv 3×3, 64 filters → 16×16×64 → MaxPool 2×2 → 8×8×64 → Conv 3×3, 128 filters → 8×8×128 → MaxPool 2×2 → 4×4×128 → Flatten 2048 → Dense 256, ReLU → Dense 10, softmax. Print each shape under its block. Conv blue, pooling orange, dense green, with a legend.
CNN Image Classifier
Prompt
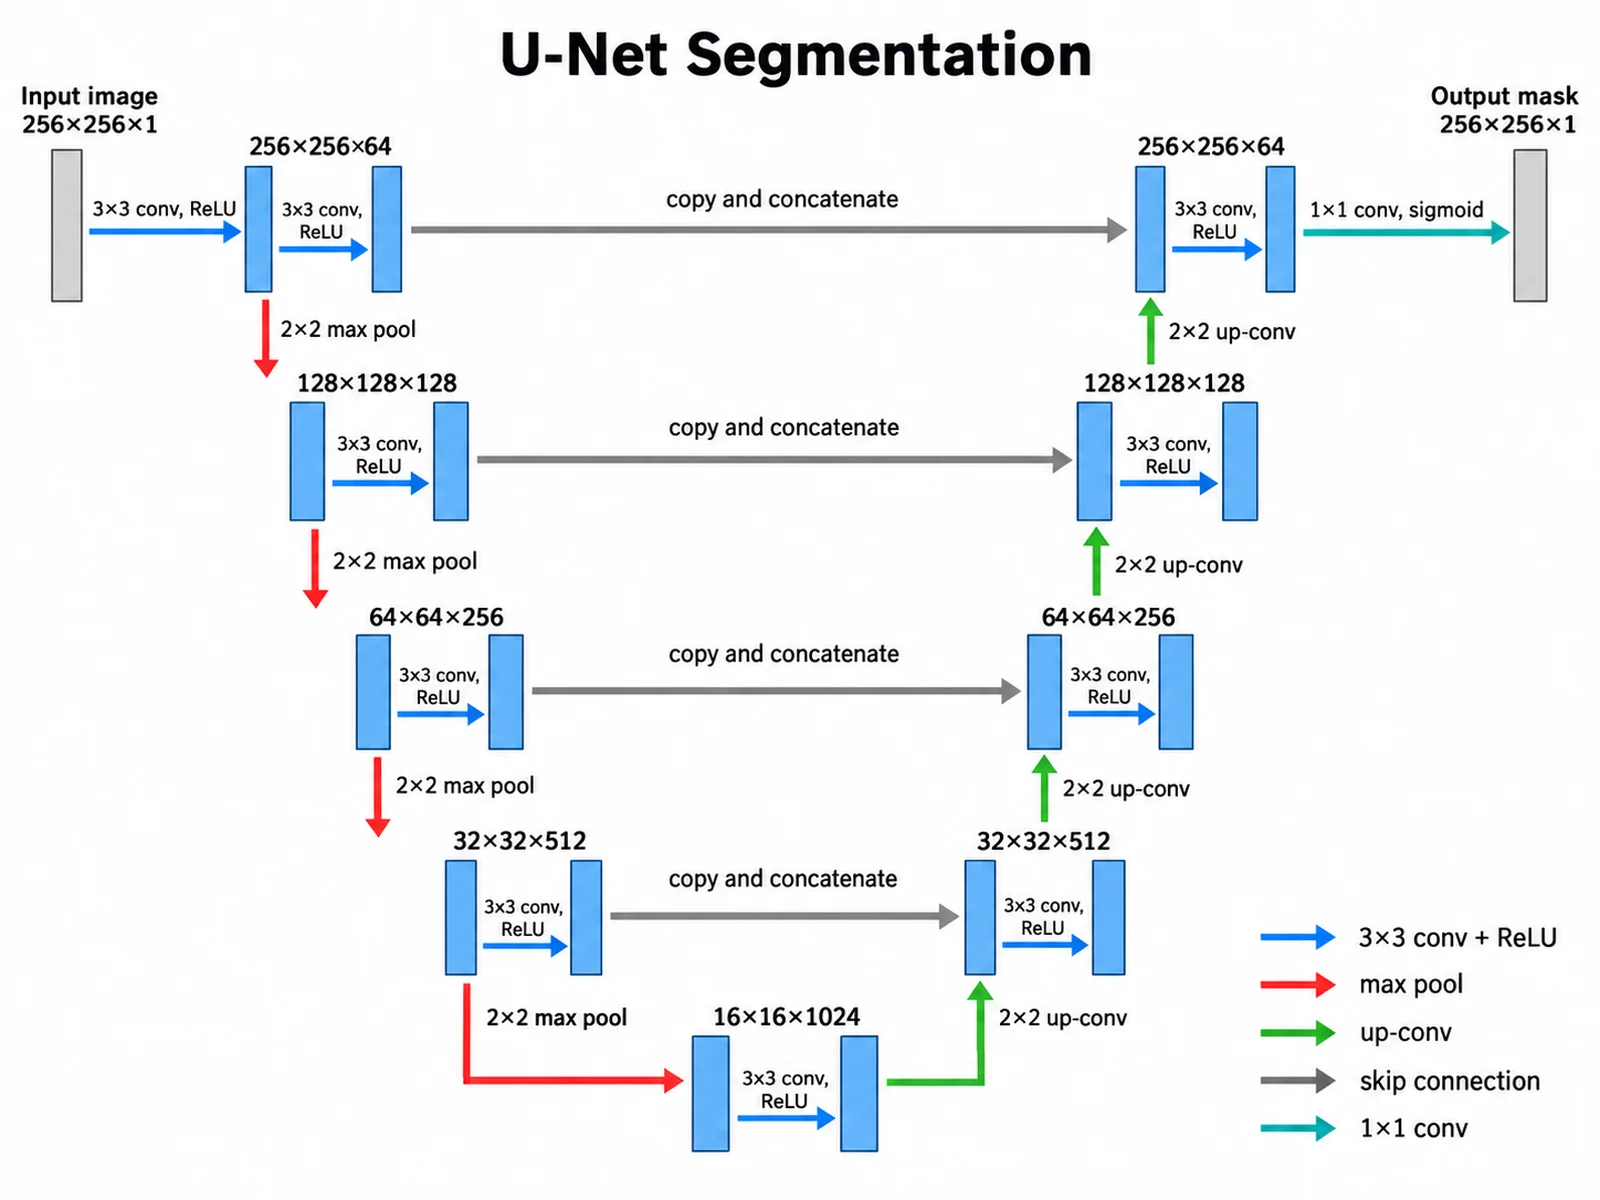
Create a U-Net segmentation diagram in a U shape. Encoder going down, each level two 3×3 conv + ReLU with same padding: 256×256×64, 128×128×128, 64×64×256, 32×32×512, connected by red 2×2 max-pool arrows. Bottleneck: 16×16×1024. Decoder going up with green 2×2 up-convolution arrows: 32×32×512, 64×64×256, 128×128×128, 256×256×64. Gray horizontal "copy and concatenate" skip arrows join each encoder level to the decoder level of the same size. Final 1×1 conv → 256×256×1 mask, sigmoid. Input: 256×256×1 image.
U-Net Segmentation Model
Prompt
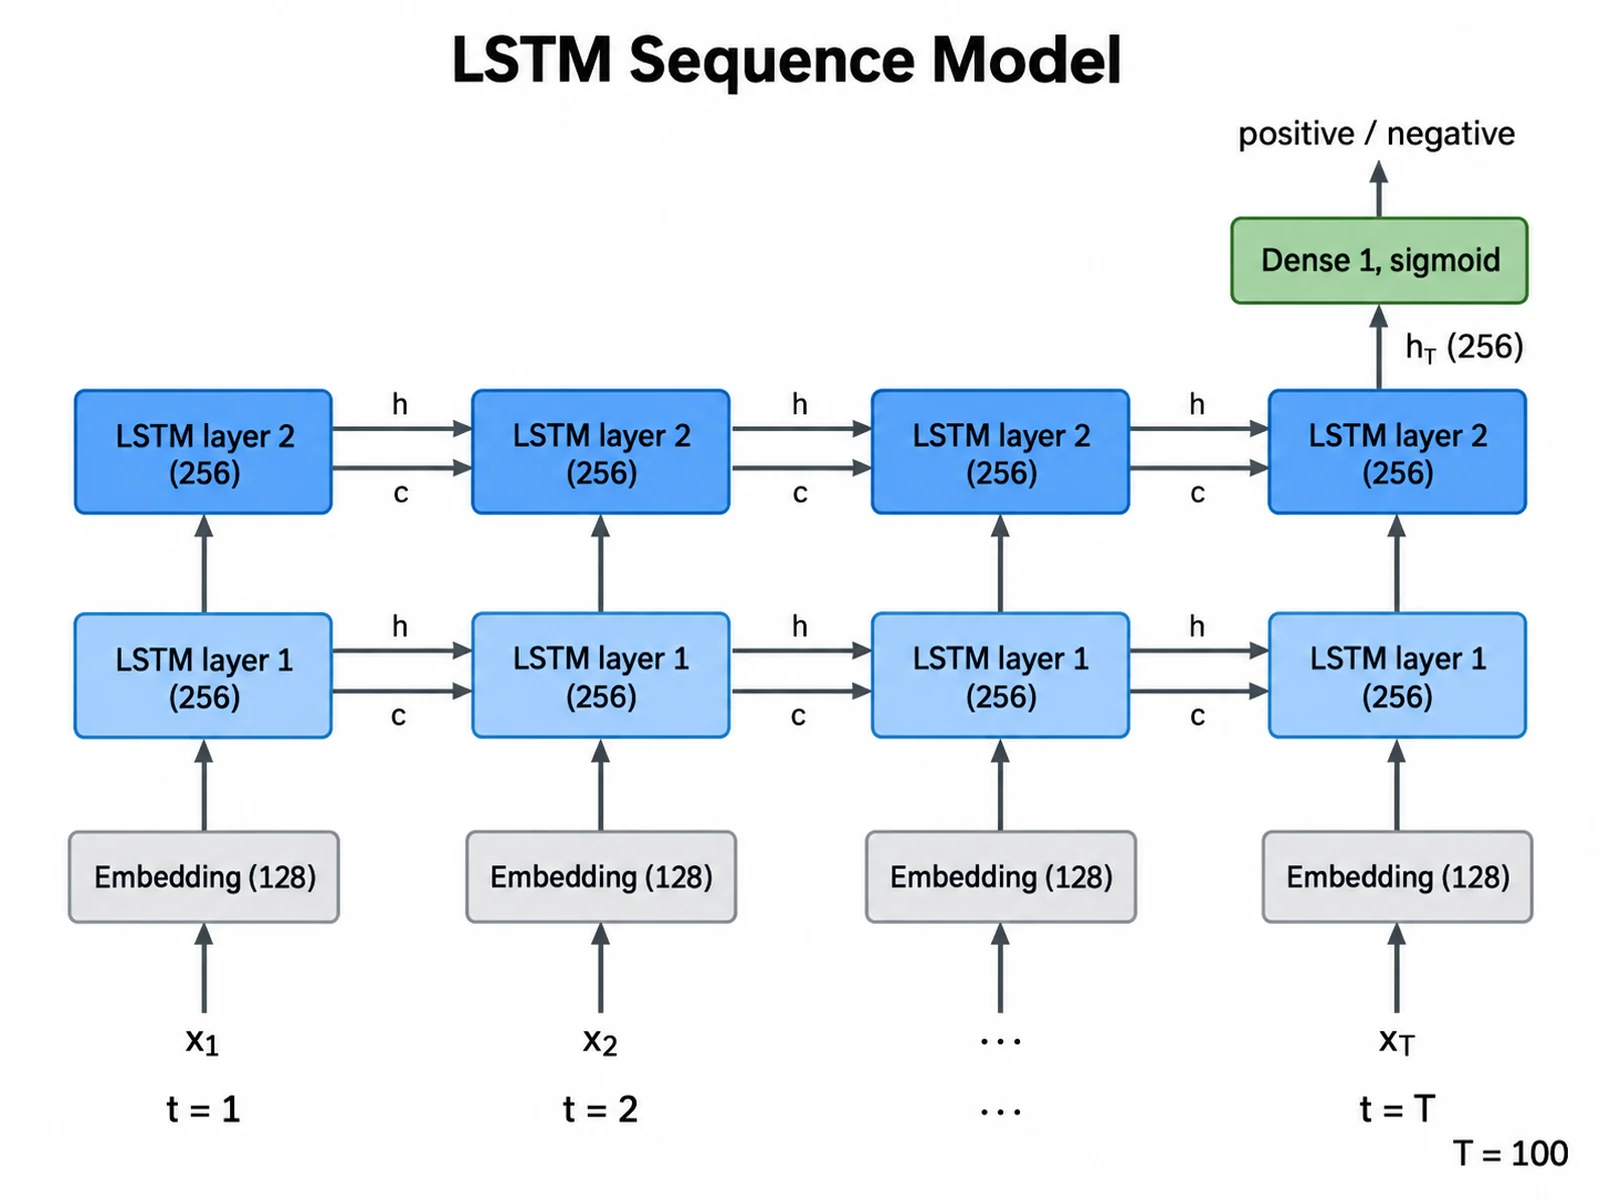
Create a deep learning model diagram of a two-layer LSTM sentiment classifier unrolled over time steps t = 1, 2, …, T (T = 100). Bottom row: input tokens x1, x2, …, xT → embedding (128). Middle rows: LSTM layer 1 cells and LSTM layer 2 cells, hidden size 256, with horizontal arrows carrying hidden state h and cell state c between time steps. Only the final hidden state h_T of layer 2 (256) goes up to Dense 1 with sigmoid → "positive / negative". Label the time axis. Clean, flat, white background.
LSTM Sequence Model
Prompt
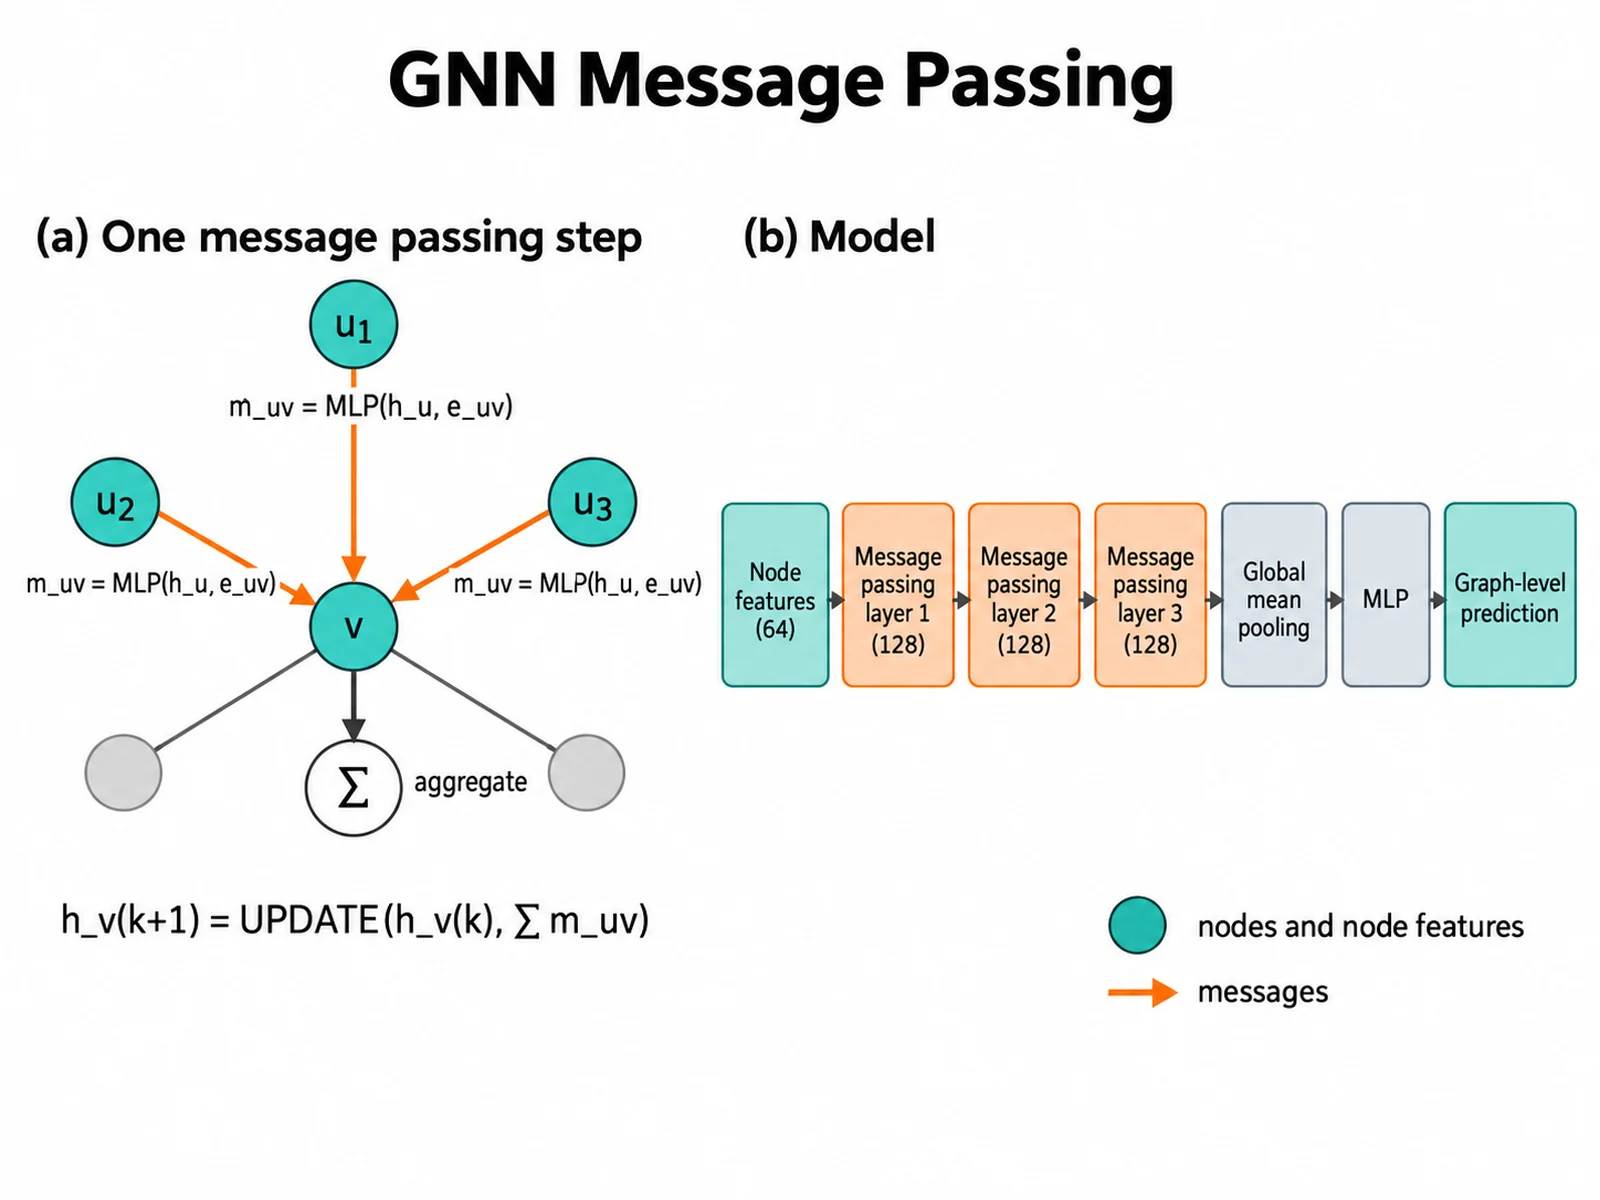
Create a graph neural network diagram in two panels. Left panel: a small graph with a central node v and neighbors u1, u2, u3; arrows from each neighbor to v labeled m_uv = MLP(h_u, e_uv); a sum symbol labeled "aggregate"; and the update h_v(k+1) = UPDATE(h_v(k), Σ m_uv). Right panel pipeline: node features (64) → message passing layer 1 (128) → layer 2 (128) → layer 3 (128) → global mean pooling → MLP → graph-level prediction. Nodes teal, messages orange. White background.
Graph Neural Network Message Passing
Prompt
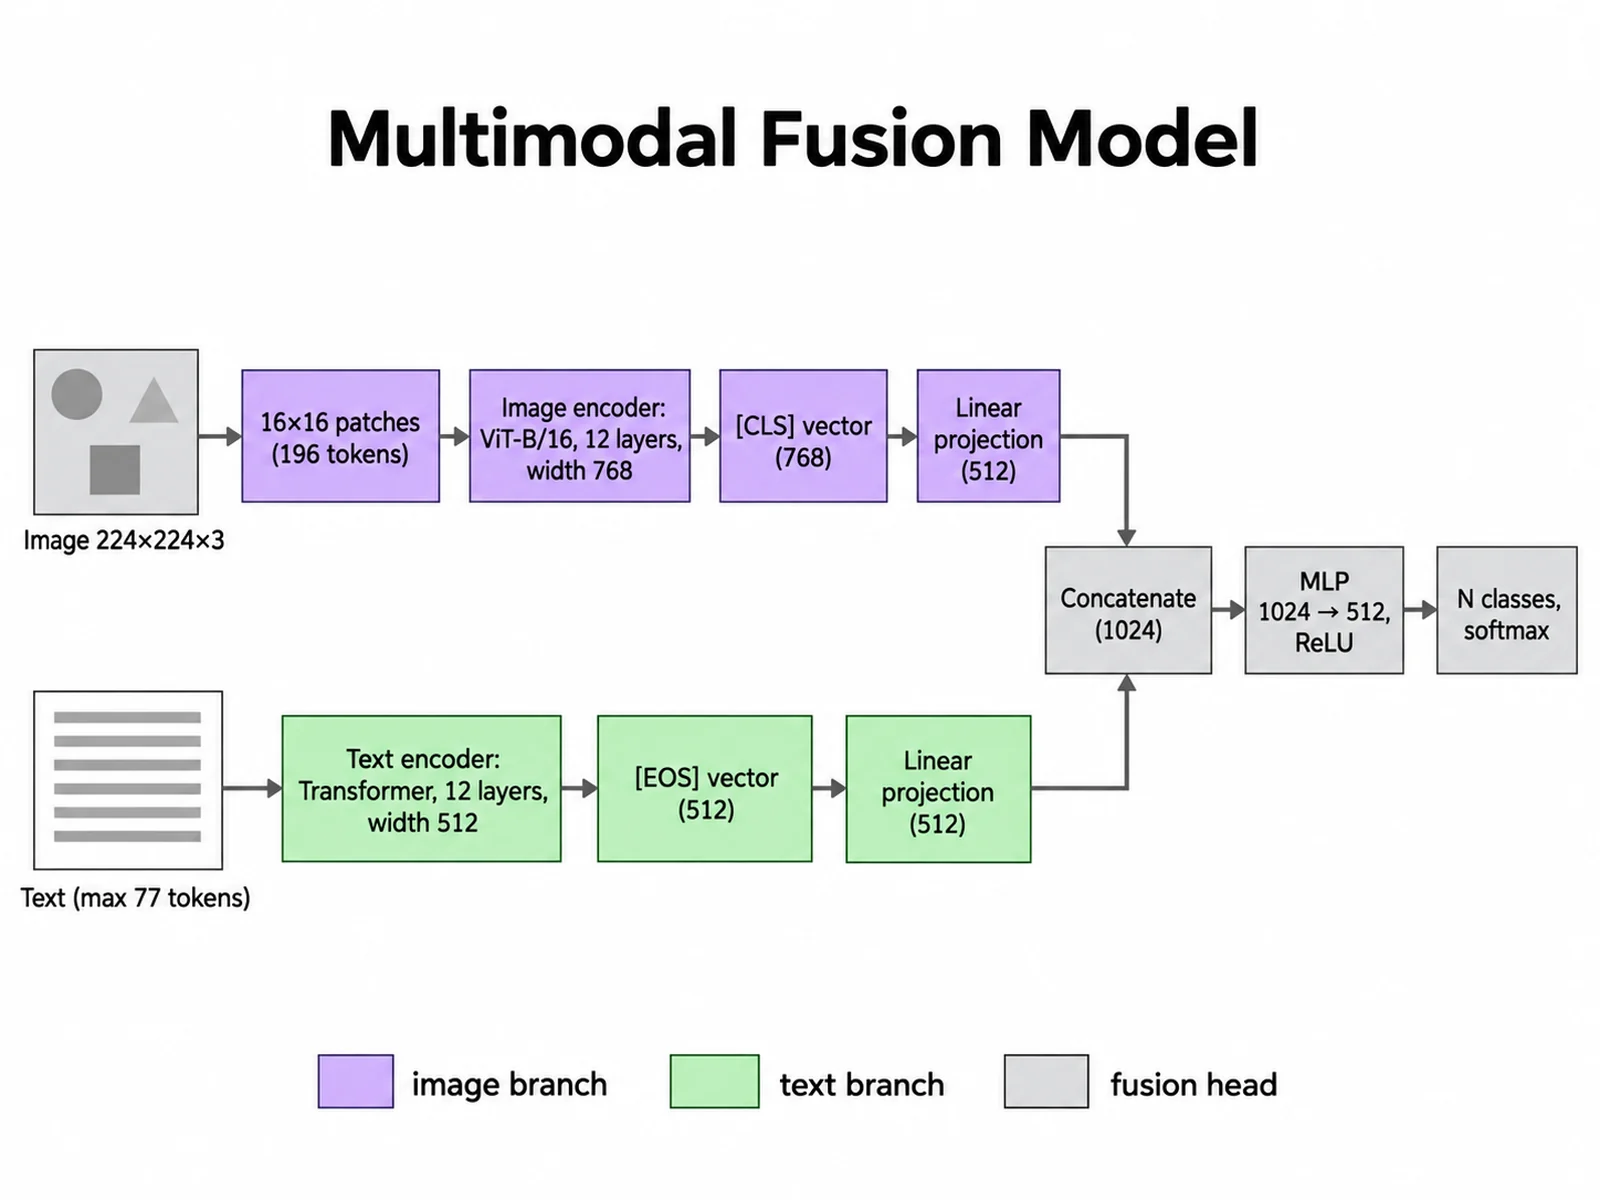
Create a multimodal model architecture diagram with two parallel branches. Top branch: image 224×224×3 → split into 16×16 patches (196 tokens) → ViT-B/16 image encoder, 12 layers, width 768 → [CLS] vector 768 → linear projection 512. Bottom branch: text, max 77 tokens → transformer text encoder, 12 layers, width 512 → [EOS] vector 512 → linear projection 512. Both join a fusion head: concatenate (1024) → MLP 1024 → 512, ReLU → N classes, softmax. Image branch purple, text branch green, fusion gray.
Multimodal Fusion Model
How to make a neural network diagram
1
Write the architecture
List the layers in order with their type, size, and output shape. Name every skip connection, repeated block, and branch.
2
Set the visual encoding
Choose the flow direction, a color for each layer type, and whether blocks are flat boxes or 3D volumes.
3
Generate and verify
Generate the figure, check every label and dimension against your code, then refine the prompt and regenerate if needed.
Notation conventions for neural network architecture diagrams
Tensor shape labels: print the output shape after each block, in one format for the whole figure, such as H×W×C for images or (batch, seq_len, d_model) for sequences.
Skip connections: draw residual and U-Net skips as curved or dashed arrows that end in a visible merge node, marked ⊕ for addition or labeled "concat" for concatenation.
Repeated blocks: draw one copy inside a bracket or outline labeled ×N, such as "×6" for a six-layer transformer encoder, instead of six identical stacks.
Color-coding layer types: give convolution, pooling, normalization, attention, and dense layers one color each, and add a legend. Do not use color as the only cue; the labels should still name each layer.
How to describe an architecture precisely in a prompt
Write the model as an ordered chain with arrows, and put the shape after each step: "Input 32×32×3 → Conv 3×3, 32 filters → 32×32×32 → MaxPool 2×2 → 16×16×32". The generator follows what you write, so vague prompts like "a deep CNN" produce vague figures.
State the layout (left to right, bottom to top, or U shape), which connections skip ahead, where branches merge, and which blocks repeat. Give exact label text in quotes when wording matters. For CNN architecture diagrams, say whether you want 3D volumes or flat boxes.
Compared with PlotNeuralNet, draw.io, and NN-SVG
PlotNeuralNet is an MIT-licensed project that generates LaTeX/TikZ code for architecture drawings, with an optional Python interface. It suits authors who already write in LaTeX and want the figure as code. NN-SVG is an MIT-licensed parametric tool that exports SVG in FCNN, LeNet, and AlexNet styles, which is ideal when your model fits those styles. draw.io is a free, Apache 2.0 general-purpose diagram editor for the web and desktop that gives you manual control over every shape.
This generator is best for a fast, polished first draft of an architecture those tools do not template, such as a multimodal or graph model, when you do not want to write TikZ or place every box by hand. Its output is a PNG image rather than exact vector geometry. Last checked: September 15, 2026, from the official PlotNeuralNet (github.com/HarisIqbal88/PlotNeuralNet), NN-SVG (github.com/alexlenail/NN-SVG), and draw.io (github.com/jgraph/drawio) repositories.
Accuracy tips before you publish
Count the blocks in the image and compare them with your model definition, including repeated ×N stacks.
Recompute shapes: a 2×2 pool with stride 2 halves height and width, and Flatten of 4×4×128 gives 2048.
Check that every skip connection starts and ends at the matching layers and resolutions.
Read each label letter by letter; image models can misspell terms such as "LayerNorm" or swap numbers.
Match the names in the figure to the names in your methods section and code.
Neural Network Diagram Generator FAQ
It draws architecture figures from a text description: CNNs, transformers, U-Nets, RNN and LSTM models, graph neural networks, autoencoders, and multimodal models. You can ask for tensor shape labels, skip connections, repeated blocks marked ×N, attention modules, and a color legend for layer types.