
Free genetics tool
Punnett square maker with genotype and phenotype ratios
Type two parent genotypes, such as AaBb × AaBb, and this free Punnett square maker draws the grid, counts every offspring genotype and phenotype, and gives exact ratios, fractions, and percentages. It handles monohybrid, dihybrid, and trihybrid crosses, incomplete dominance, codominance, ABO blood groups, and sex-linked traits.
Quick presets
One letter per gene, uppercase = dominant, parents separated by × or x. Examples: AaBb × aabb, X^A X^a × X^A Y (sex-linked), IAi × IBi (ABO). Up to 3 genes.
Dominance and phenotype names
Gene A
Gene B
Runs entirely in your browser. Nothing you type is uploaded.
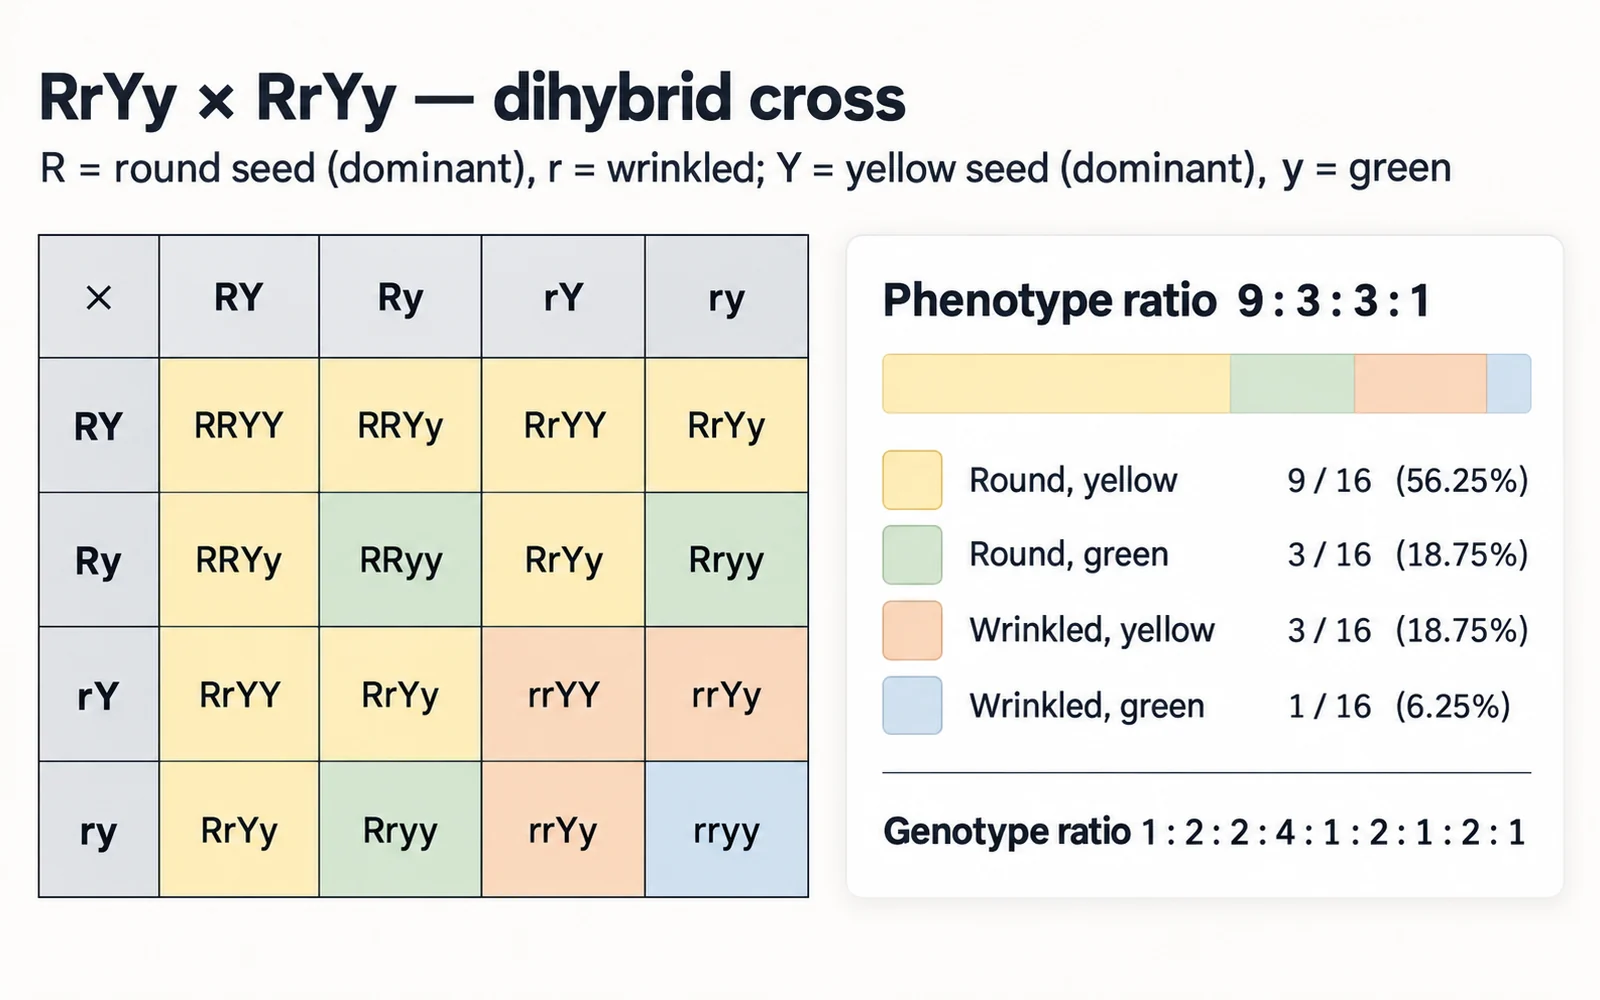
4×4 Punnett square
Cells are colored by phenotype (Paul Tol light scheme) and labeled with a phenotype code, so the grid reads without color.
Genotype ratio: 1:2:1:2:4:2:1:2:1
Phenotype ratio: 9:3:3:1
Genotypes (16 cells)
| Genotype | Count | Fraction | Percent |
|---|---|---|---|
| AABB | 1/16 | 1/16 | 6.25% |
| AABb | 2/16 | 1/8 | 12.5% |
| AAbb | 1/16 | 1/16 | 6.25% |
| AaBB | 2/16 | 1/8 | 12.5% |
| AaBb | 4/16 | 1/4 | 25% |
| Aabb | 2/16 | 1/8 | 12.5% |
| aaBB | 1/16 | 1/16 | 6.25% |
| aaBb | 2/16 | 1/8 | 12.5% |
| aabb | 1/16 | 1/16 | 6.25% |
Phenotypes
| Phenotype | Count | Fraction | Percent |
|---|---|---|---|
| P1Round seeds, Yellow seeds#77AADD | 9/16 | 9/16 | 56.25% |
| P2Round seeds, Green seeds#EE8866 | 3/16 | 3/16 | 18.75% |
| P3Wrinkled seeds, Yellow seeds#EEDD88 | 3/16 | 3/16 | 18.75% |
| P4Wrinkled seeds, Green seeds#FFAABB | 1/16 | 1/16 | 6.25% |
How to make a Punnett square
A Punnett square lists the gametes one parent can make along the top, the gametes of the other parent down the side, and fills each cell with the offspring genotype formed when those two gametes meet. Under Mendelian assumptions every gamete combination is equally likely, so each cell carries the same probability. You can do it by hand in five steps, or let the Punnett square maker above do the bookkeeping.
- Write each parent genotype with one letter per gene: uppercase for the dominant allele and lowercase for the recessive allele. AaBb is heterozygous at two genes.
- List the gametes. Each gamete receives one allele from every gene, so a parent heterozygous at n genes makes 2^n gamete types: Aa gives A and a, while AaBb gives AB, Ab, aB, and ab.
- Draw a grid with one column per gamete from the first parent and one row per gamete from the second. One gene gives a 2×2 grid, two genes a 4×4 grid, and three genes an 8×8 grid of 64 cells.
- Fill each cell by combining the row and column alleles, then count identical genotypes and group them by phenotype.
- Divide each count by the number of cells to get the expected probability. This Punnett square calculator does the counting, simplifies the fractions, and lists genotypes in a fixed order with dominant alleles first.
Genotype vs phenotype
The genotype is the pair of alleles an individual carries, such as AA, Aa, or aa. The phenotype is the trait you observe, such as purple or white flowers. Different genotypes can share one phenotype: with complete dominance AA and Aa look the same, which is why a monohybrid cross has three genotypes but only two phenotypes. Dominance decides how genotypes map to phenotypes, and you can set it separately for every gene in the tool and give each phenotype its own name.
- Complete dominance: one copy of the dominant allele is enough, so heterozygotes look like the dominant homozygote.
- Incomplete dominance: heterozygotes show an intermediate phenotype, like pink flowers from a cross between red and white snapdragons.
- Codominance: heterozygotes express both alleles. In the ABO blood group, the IA and IB alleles are codominant and i is recessive, so IAIB is type AB and ii is type O.
- Sex-linked (X-linked) genes: males carry a single X chromosome, so one recessive allele on the X is expressed. Use X^A, X^a, and Y notation for a sex-linked Punnett square and read the phenotype table separately for daughters and sons.
Classic Punnett square ratios
These are the expected ratios for unlinked genes. Load a preset above to see the full grid behind each one, and use the genetics cross calculator to compare them with the counts you actually observed.
- 3:1 phenotypes and 1:2:1 genotypes: the monohybrid cross Aa × Aa with complete dominance, the ratio Mendel reported for pea traits such as flower color and seed shape.
- 1:2:1 phenotypes: the same Aa × Aa cross with incomplete dominance or codominance, because each genotype now has its own phenotype.
- 9:3:3:1 phenotypes: the dihybrid cross AaBb × AaBb with complete dominance at both genes, spread over 16 cells and nine genotypes.
- 1:1:1:1 phenotypes: the dihybrid test cross AaBb × aabb, or the ABO cross IAi × IBi, which gives types A, B, AB, and O in equal proportions.
- 1:1 phenotypes: the monohybrid test cross Aa × aa, used to find out whether an individual with the dominant phenotype is heterozygous.
- 27:9:9:9:3:3:3:1 phenotypes: the trihybrid cross AaBbCc × AaBbCc across 64 cells.
Assumptions and limits
A Punnett square gives expected proportions, not guaranteed outcomes. It rests on assumptions that real inheritance often breaks, so treat the ratios as a model to compare with observed counts, for example with a chi-square goodness-of-fit test.
- Independent assortment: every gene is assumed to sort independently of the others. Genes close together on the same chromosome are linked and are inherited together more often than the grid predicts, unless crossing over separates them.
- Equal survival: every genotype is assumed to be equally viable. Lethal genotypes remove cells from the real ratio.
- Large numbers: the ratios are probabilities. A family with four children can easily differ from 3:1 by chance, and only large populations approach the expected proportions.
- One gene, one trait: epistasis, where one gene masks the effect of another, turns 9:3:3:1 into ratios such as 9:3:4 or 9:7. Polygenic traits such as height depend on many genes plus the environment.
- Not modeled: incomplete penetrance, variable expressivity, mitochondrial inheritance, and genomic imprinting.
Using the grid in slides, worksheets, and papers
The SVG export keeps every label as text, so you can restyle it in a vector editor such as Inkscape or Illustrator. The PNG export is rendered at twice the on-screen size for slides and handouts, and the CSV contains the genotype table, the phenotype table, and the full grid for spreadsheets. Cell colors come from Paul Tol's light qualitative scheme, which was designed for cells with dark labels on top. Every cell also carries a phenotype code (P1, P2, and so on) that matches the key, with the HEX value printed next to each swatch, so the square still reads in grayscale and for readers with color vision deficiency.
Frequently asked questions
Is this Punnett square maker free, and does it upload anything?
Yes, it is free and needs no account. All calculations and drawing happen in your browser, so the genotypes and trait names you type never leave your device.
How do I enter a dihybrid or trihybrid cross?
Type both parents with one letter per gene, separated by × or x, for example AaBb × AaBb or AaBbCc × aabbcc. Letters must match between parents and each gene needs two alleles. The dihybrid cross calculator then builds a 4×4 grid, and three genes give an 8×8 grid.
How do I make a sex-linked Punnett square?
Write X-linked alleles with a caret and the Y chromosome as Y, for example X^H X^h × X^H Y for a carrier mother and an unaffected father in a hemophilia cross. The tool assigns a sex to each offspring and splits the phenotype ratio by sex: all daughters are unaffected (half are carriers) and half of the sons are expected to have hemophilia. You can add autosomal genes to the same cross.
Can it handle the ABO blood group with three alleles?
Yes. Write the alleles as IA, IB, and i (I^A and I^B also work). A cross such as IAi × IBi returns types A, B, AB, and O in a 1:1:1:1 ratio. The ABO gene always uses codominance between IA and IB, with i recessive.
Why are the genotype and phenotype ratios different?
Several genotypes can produce the same phenotype. With complete dominance AA and Aa look alike, so Aa × Aa gives a 1:2:1 genotype ratio but a 3:1 phenotype ratio. Switch the gene to incomplete dominance and the two ratios match.
Does a Punnett square predict the actual number of offspring?
No. It gives the probability of each outcome for every offspring independently. Real counts vary by chance, especially in small families or litters, and linkage, lethal genotypes, epistasis, and environment can shift the ratios further.
Related tools
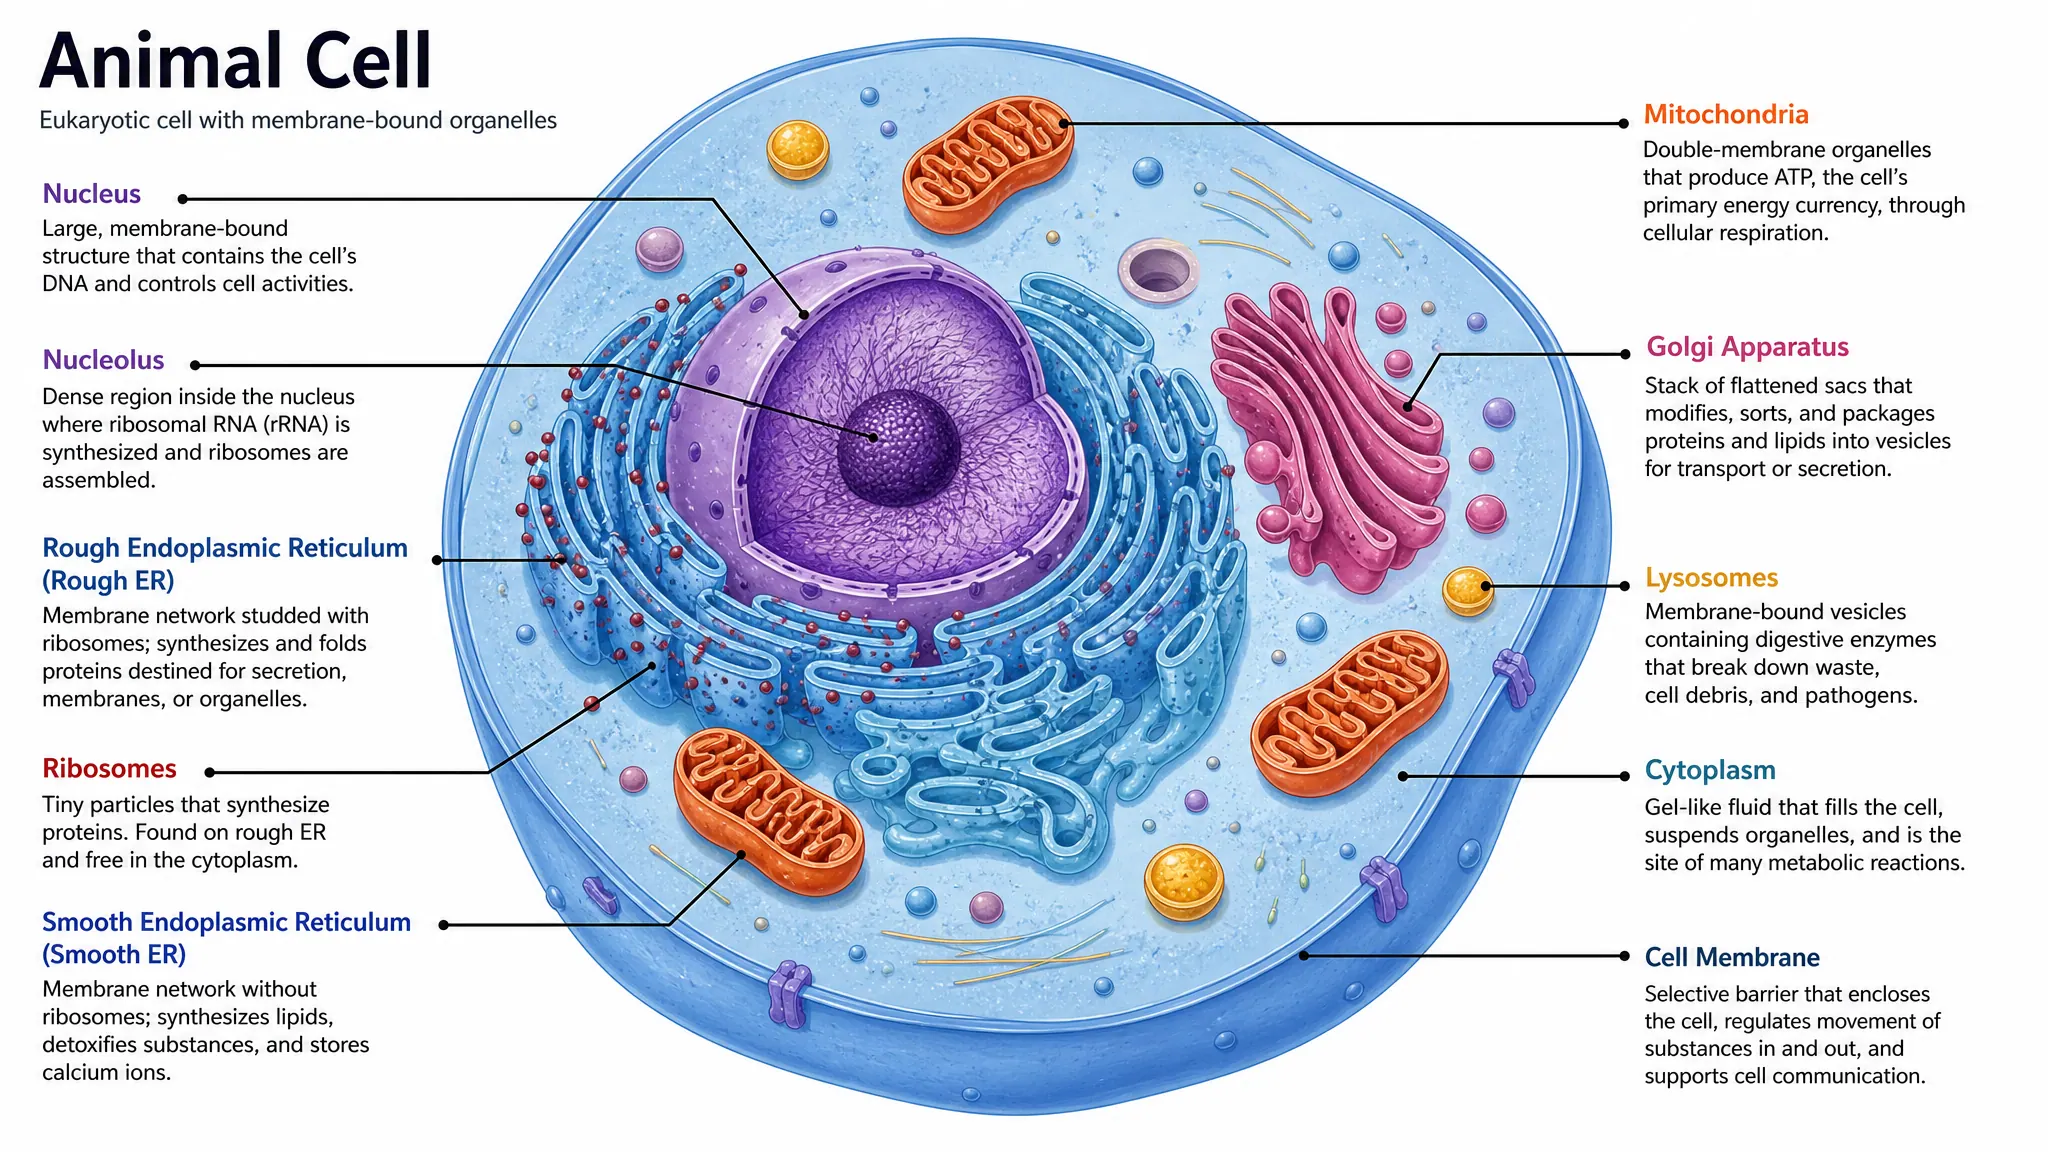
Biology diagram maker
Turn a text description into a labeled biology figure for lectures, worksheets, and papers.
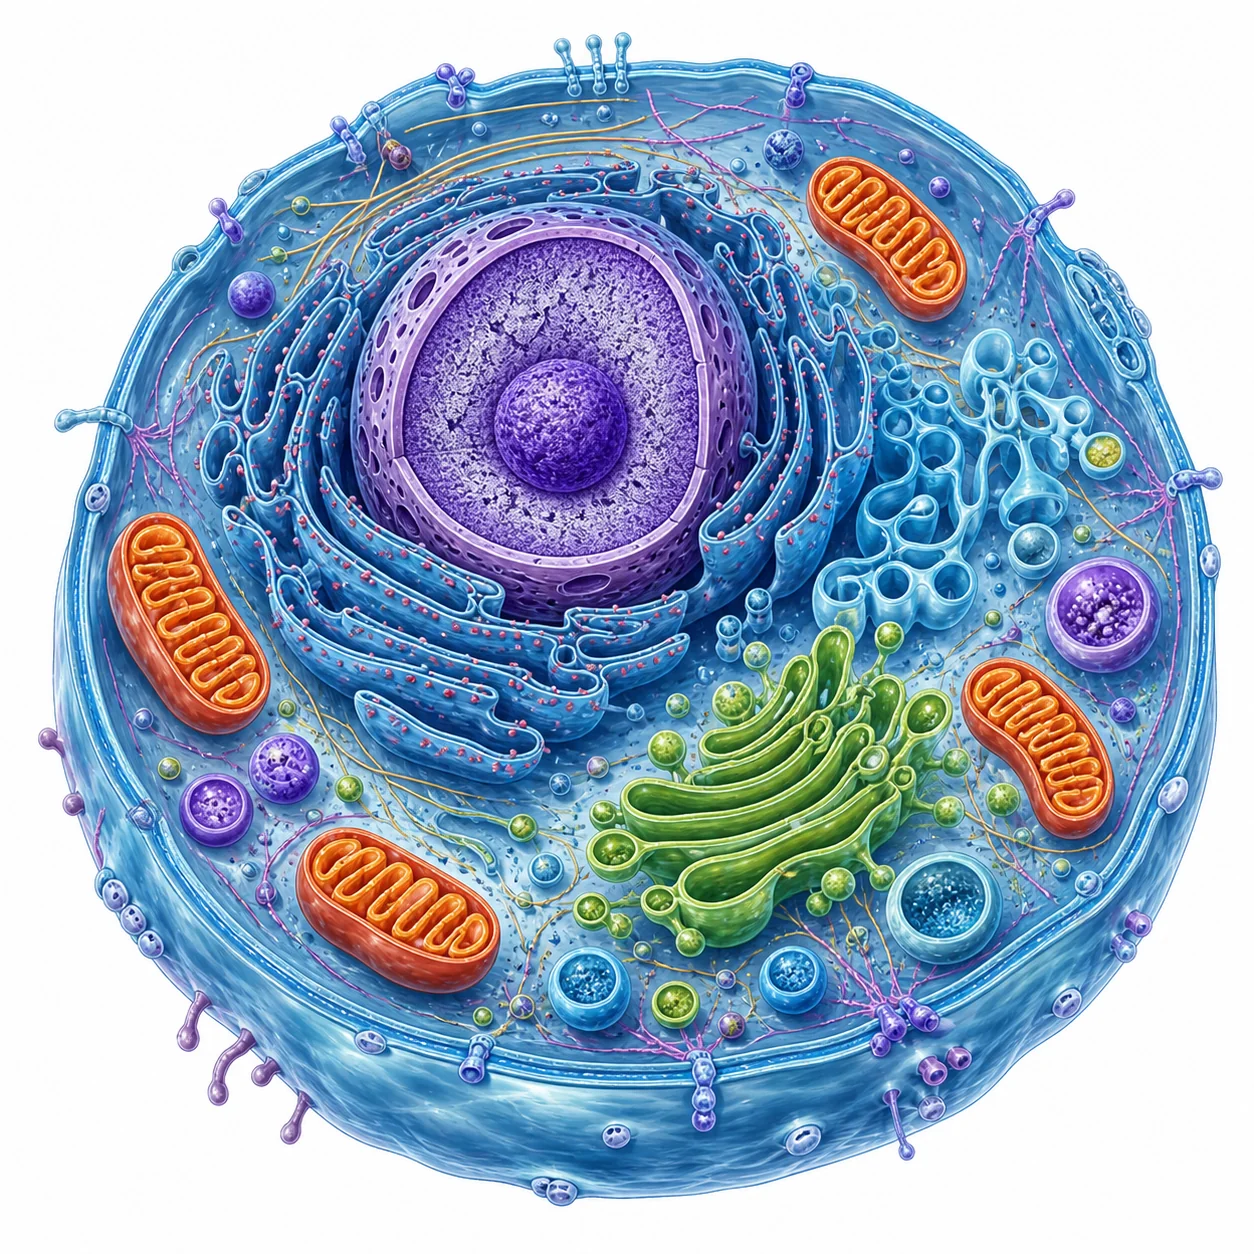
Cell diagram generator
Create labeled cell illustrations to pair with genetics lessons and figures.
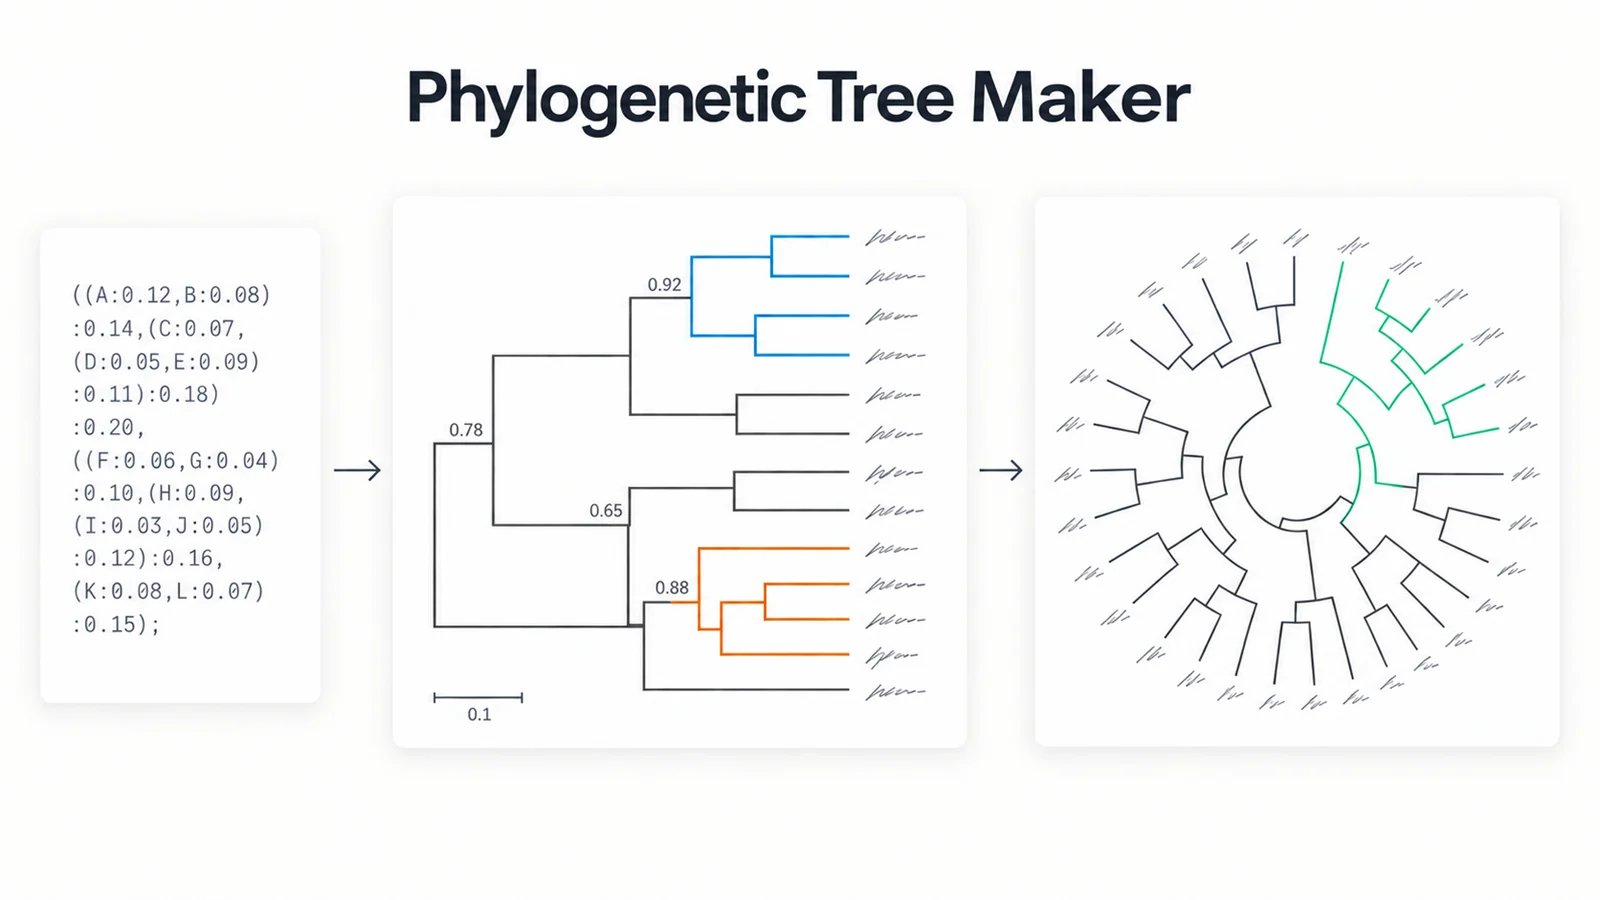
Phylogenetic tree maker
Paste a Newick tree and draw a clean rectangular, cladogram, or circular phylogeny.
All SciFigure tools
Browse the AI figure generators, chart generators, and free figure tools in one place.
DNA replication diagram
Draw labeled replication and central dogma figures to pair with genetics lessons.
Concept map generator
Turn a genetics topic into a labeled concept map for a study sheet.
Illustrate the biology behind the cross
Describe a meiosis, chromosome, or inheritance figure and let the SciFigure biology diagram maker draw it. AI illustration requires a subscription or a credit pack; the smallest pack is $1 for 10 credits.
Open the biology diagram makerLast checked: September 15, 2026. Sources: Paul Tol, Colour schemes (light qualitative scheme, Fig. 8).