Prompt
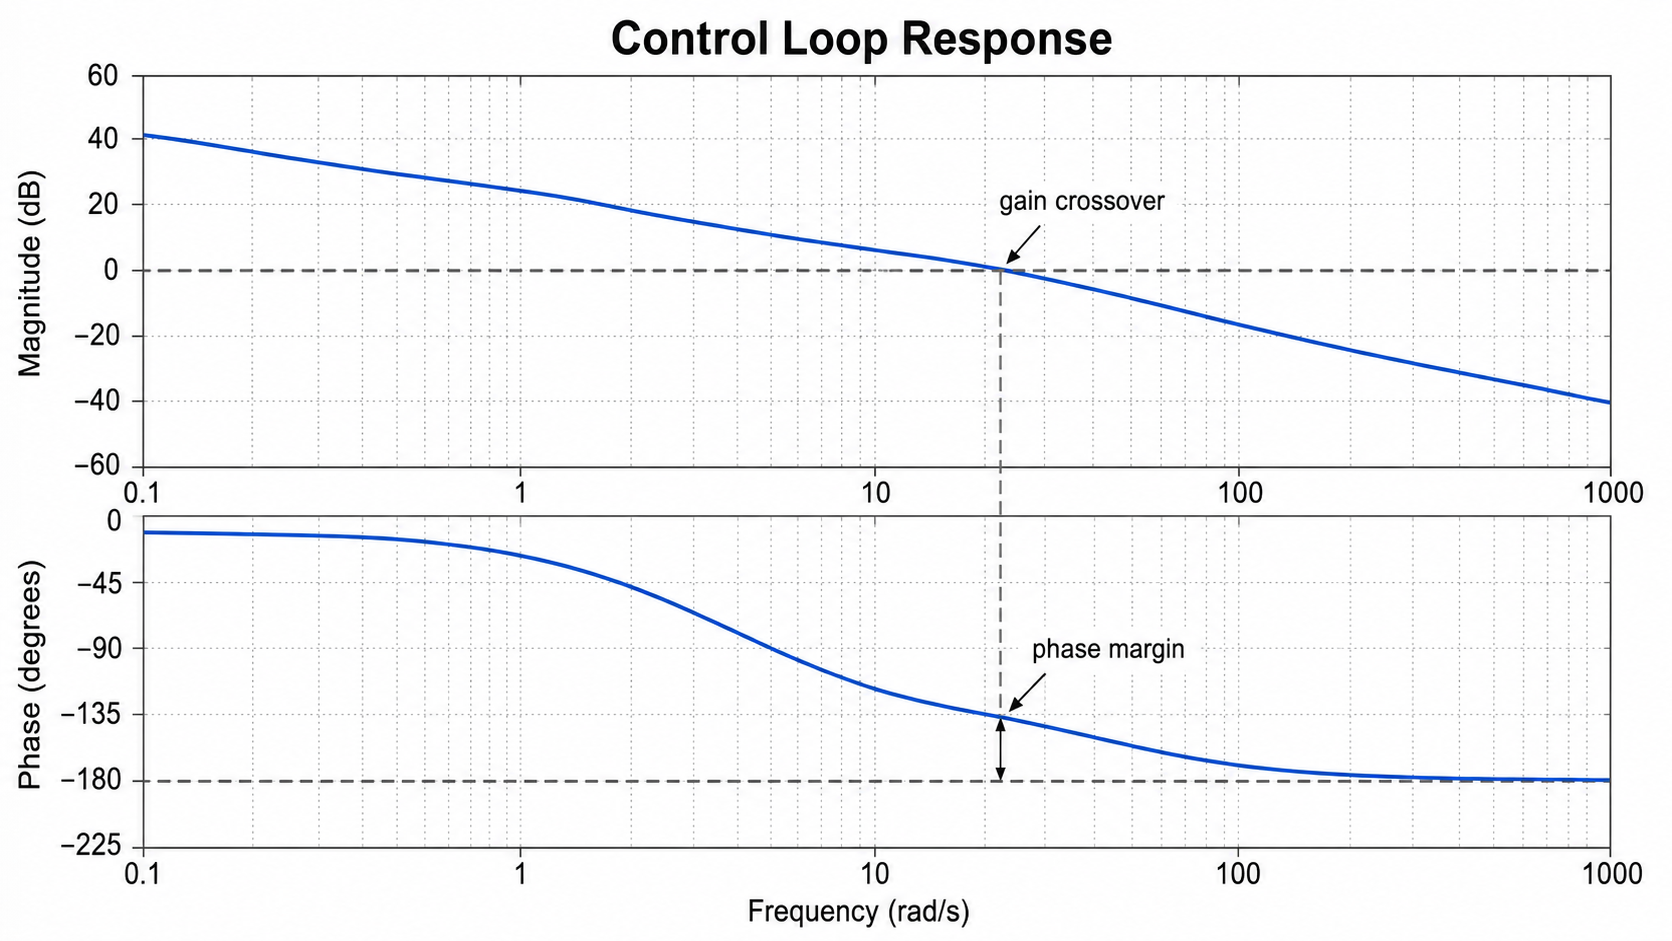
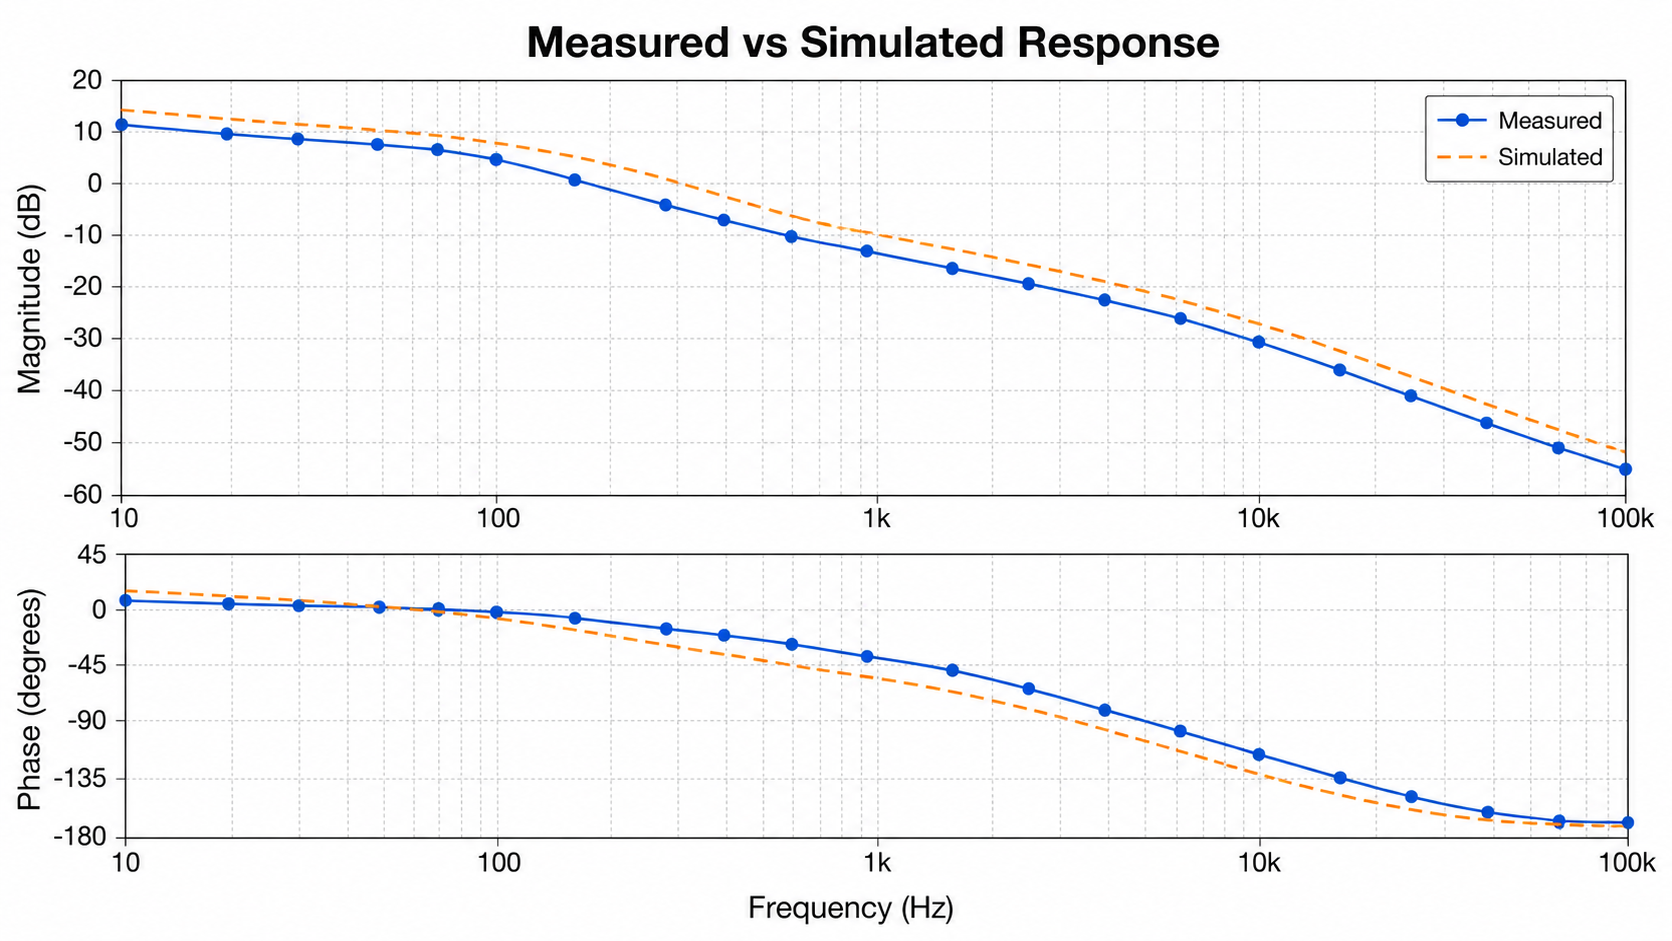
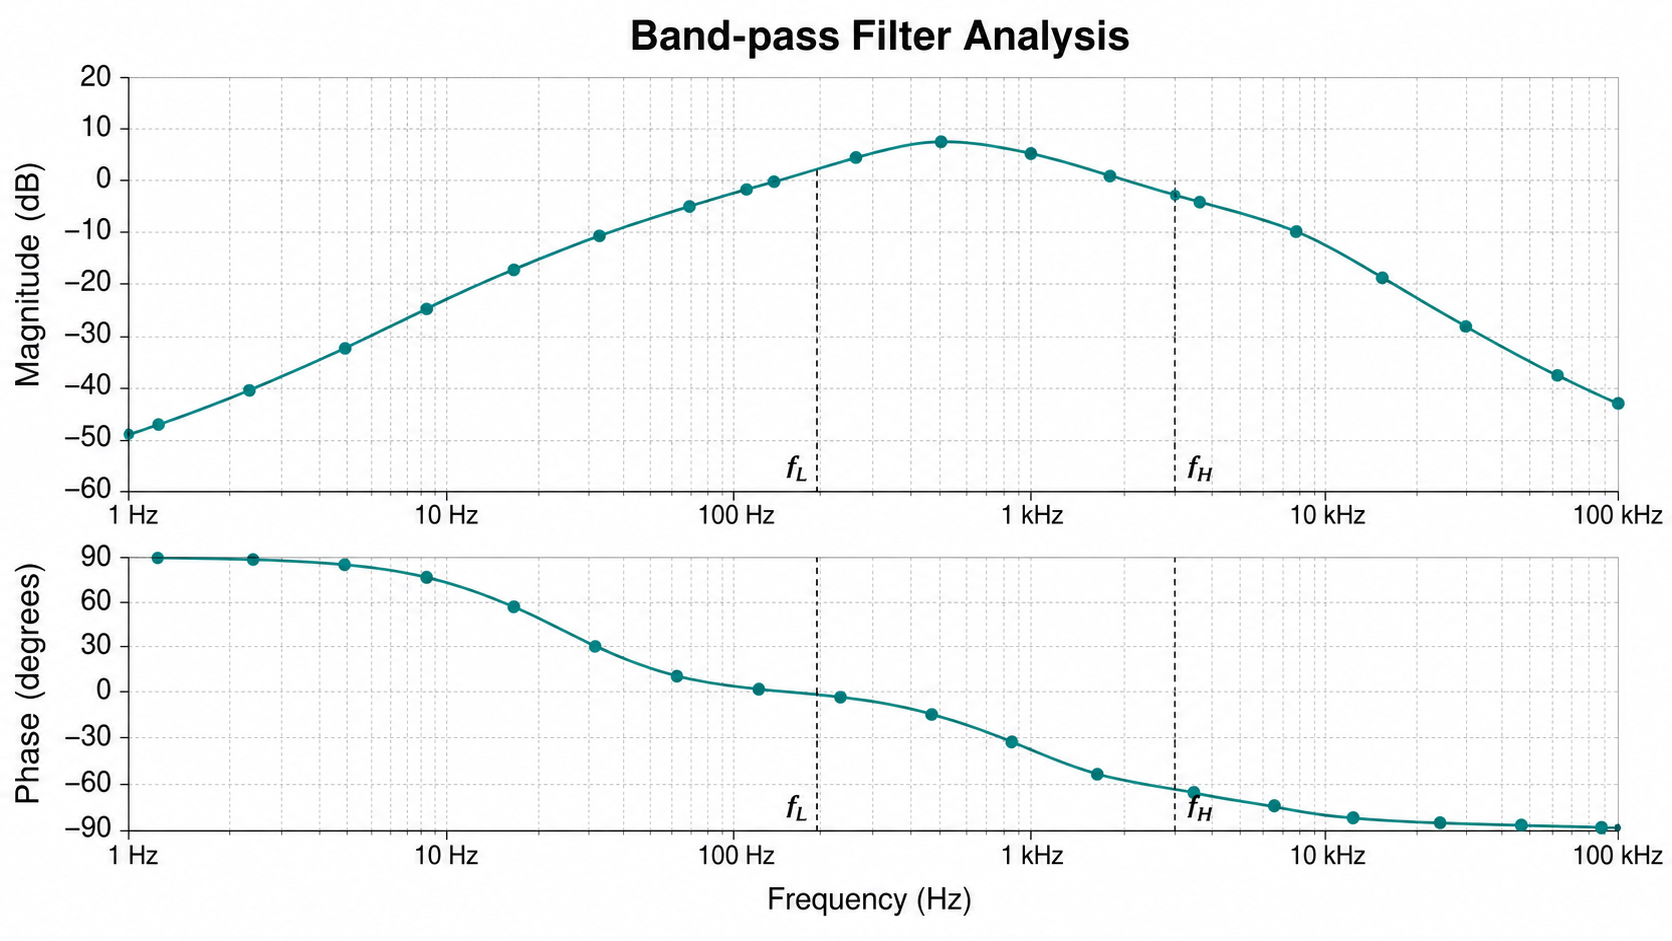
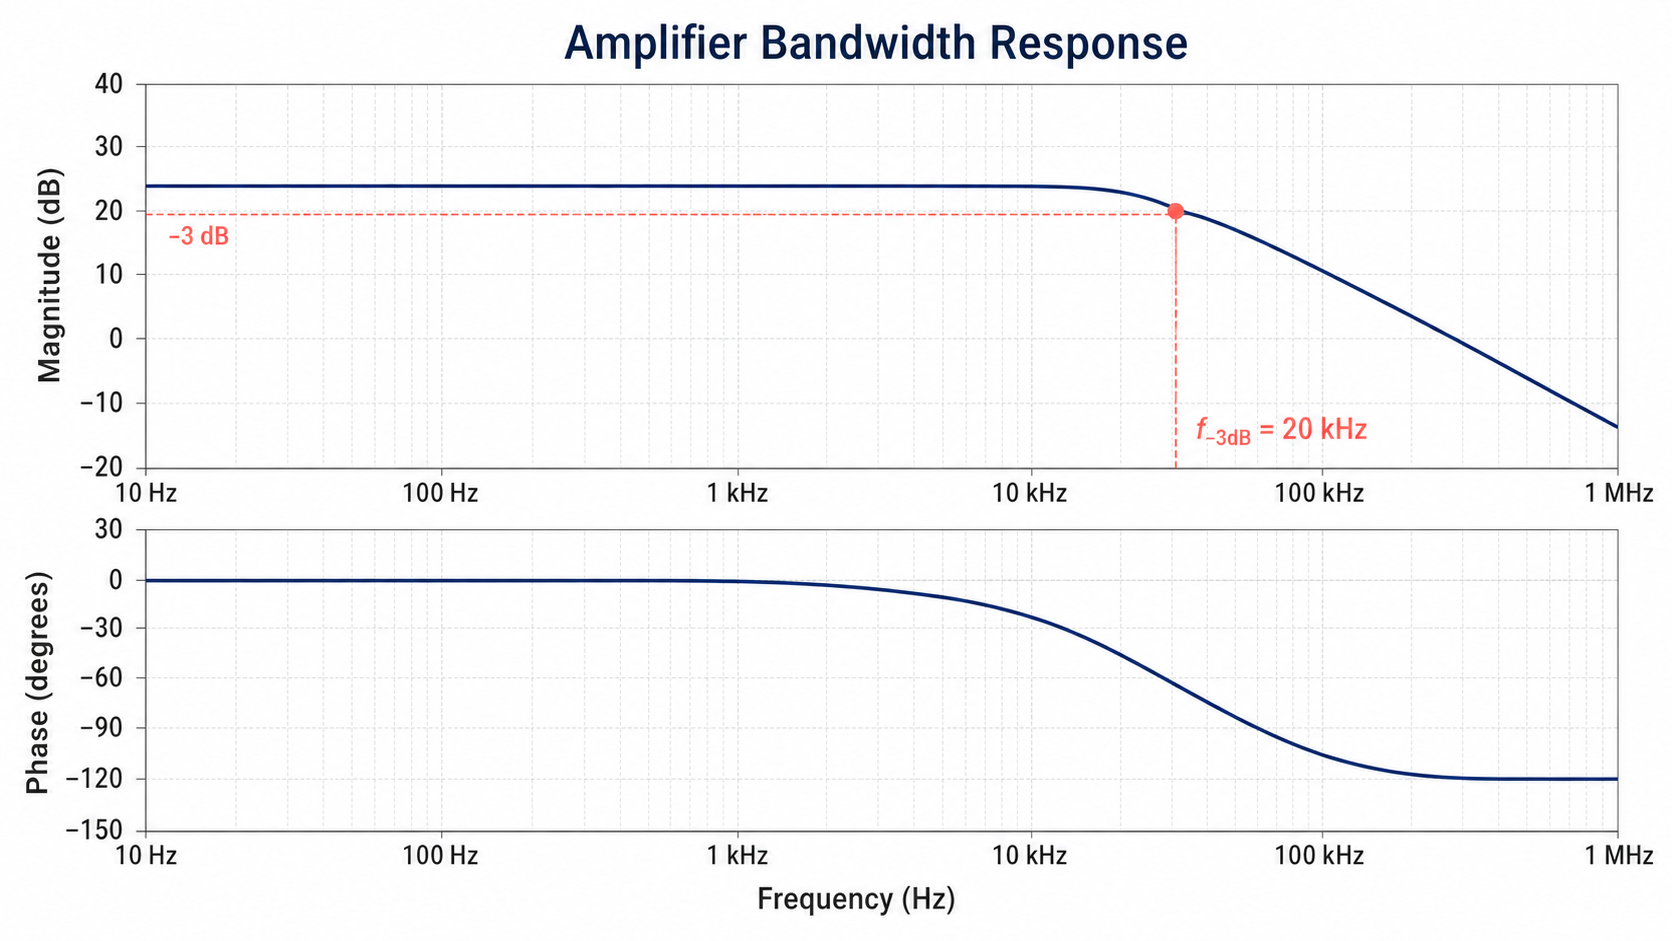
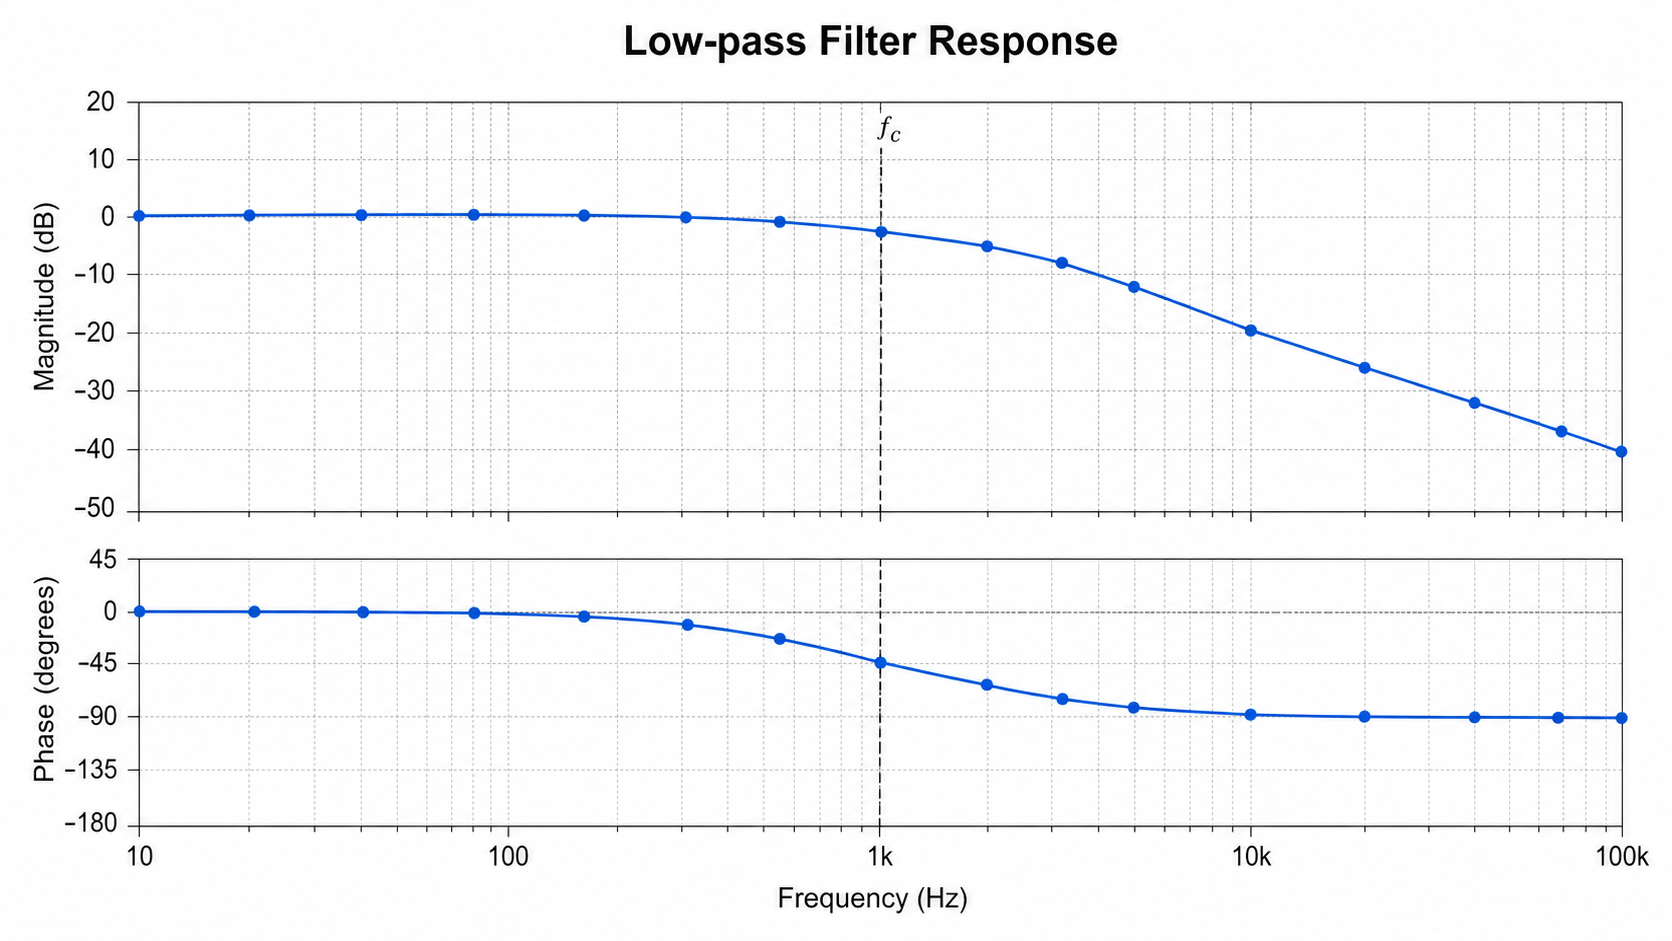
Based on the uploaded low_pass_filter_response.csv file, create a publication-ready Bode plot for a low-pass filter. Use positive frequency values on a logarithmic x-axis, show magnitude in dB and phase in degrees as stacked panels, preserve measured points, and mark cutoff frequency only when the data or prompt supports it.