Instrucción
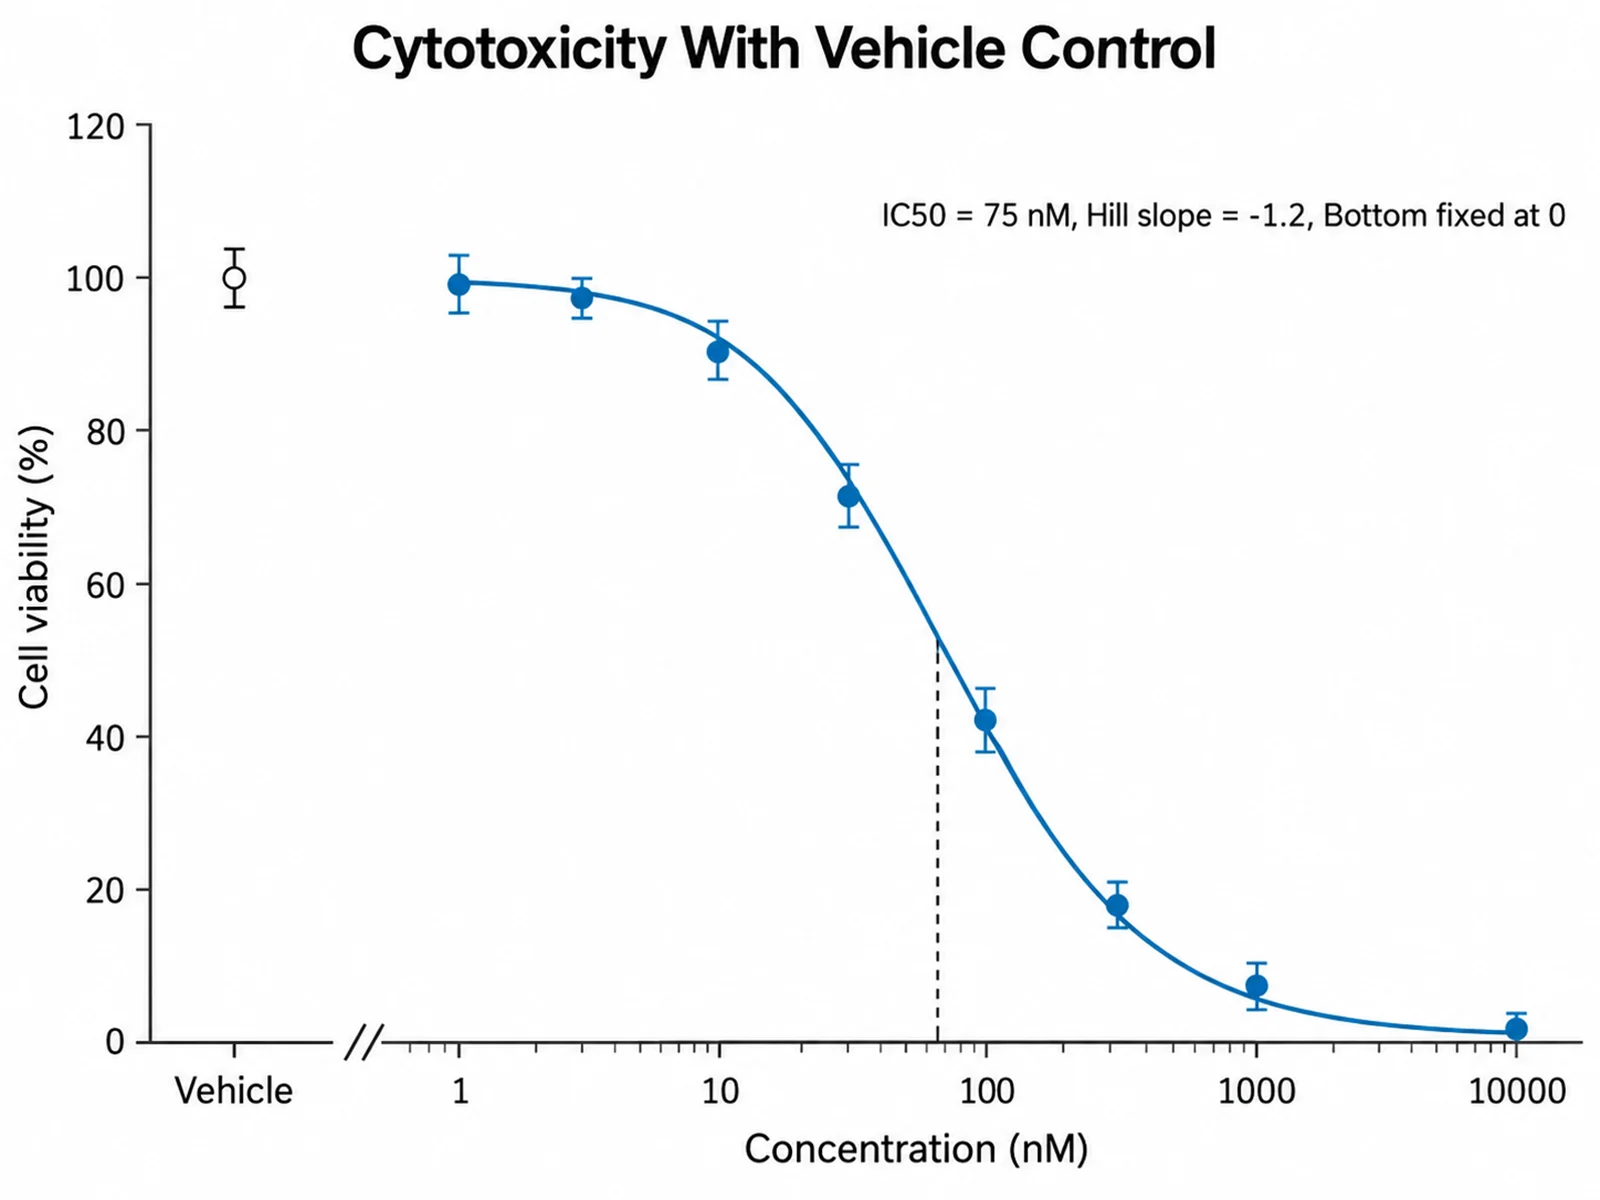
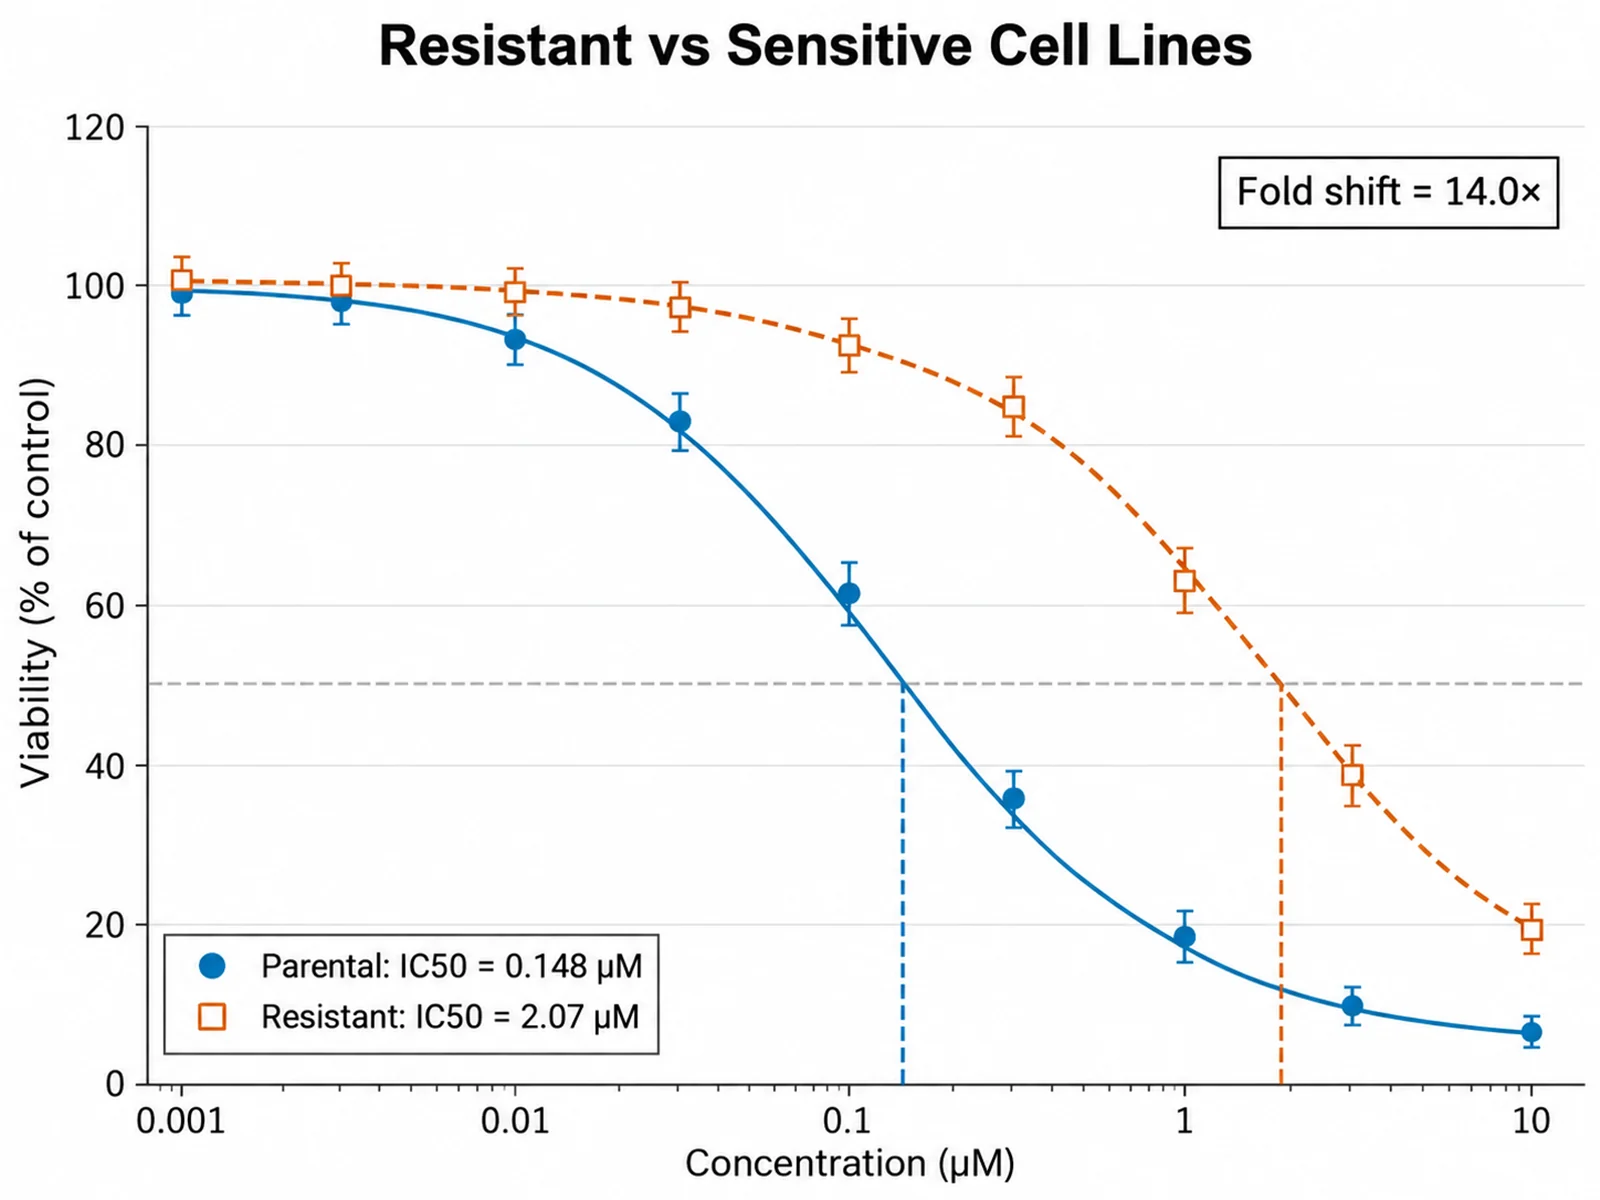
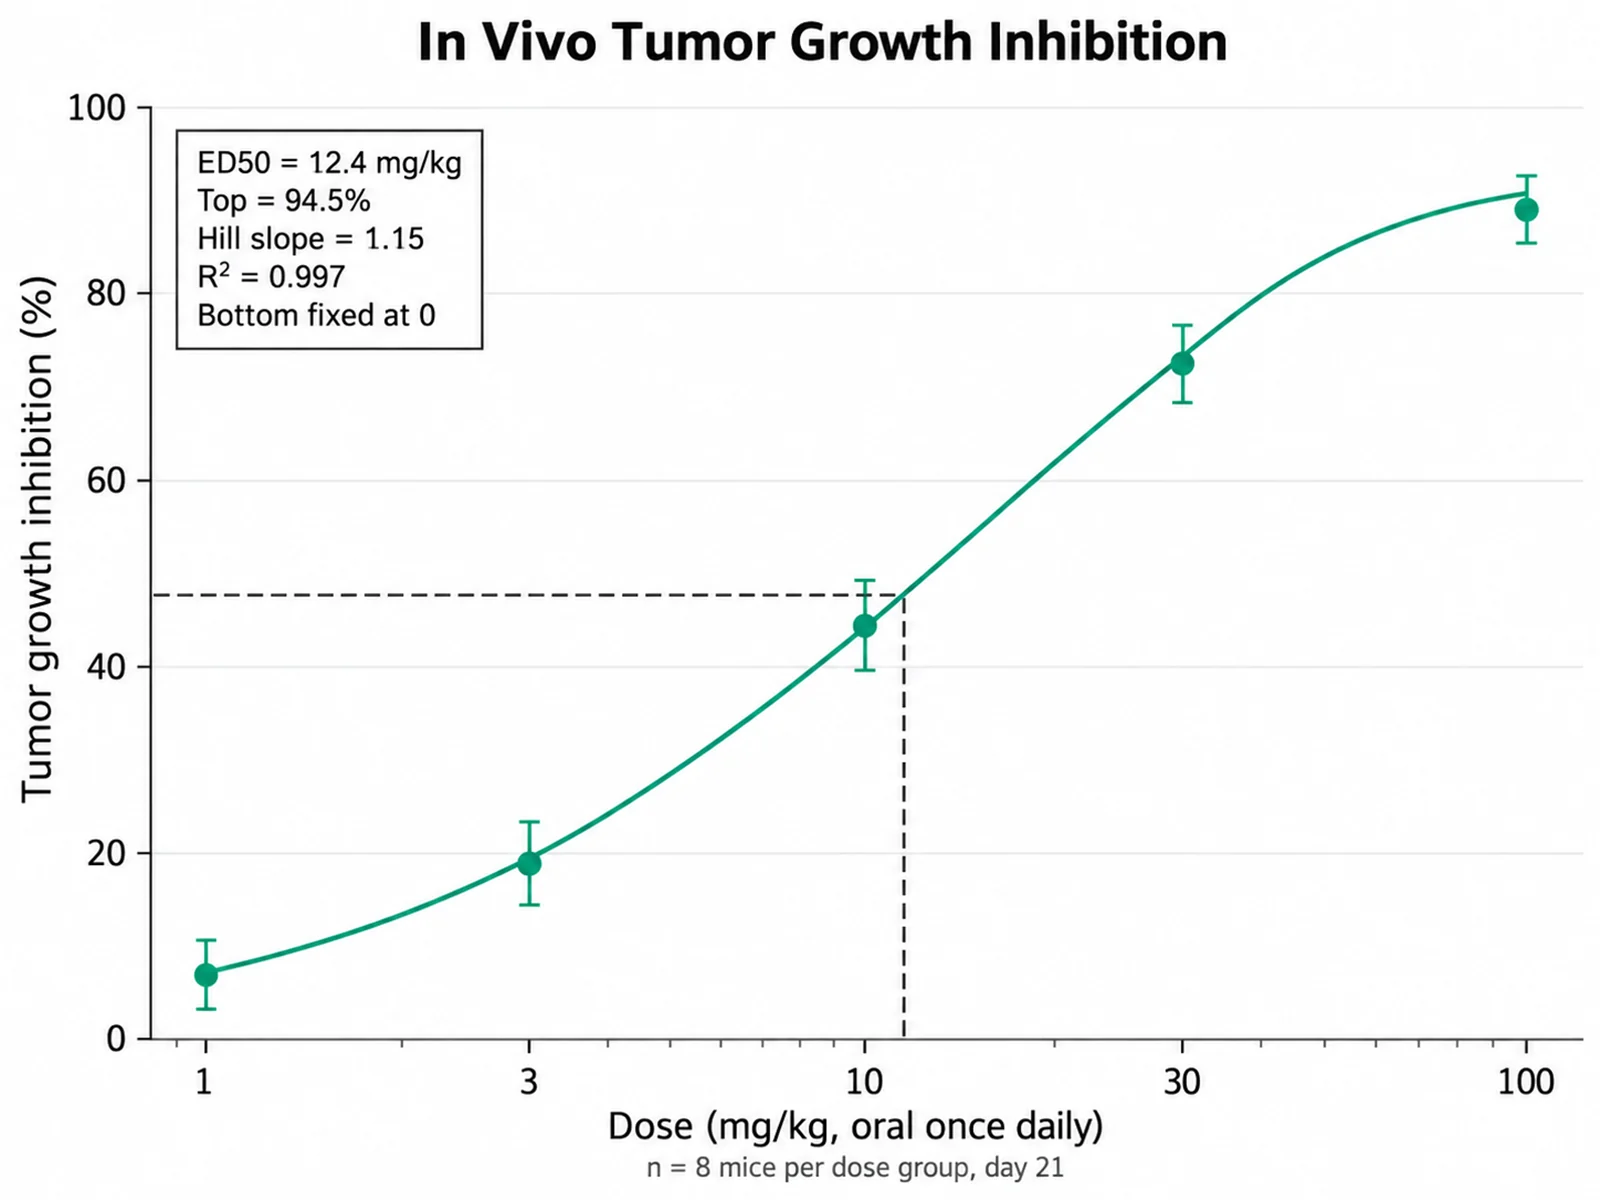
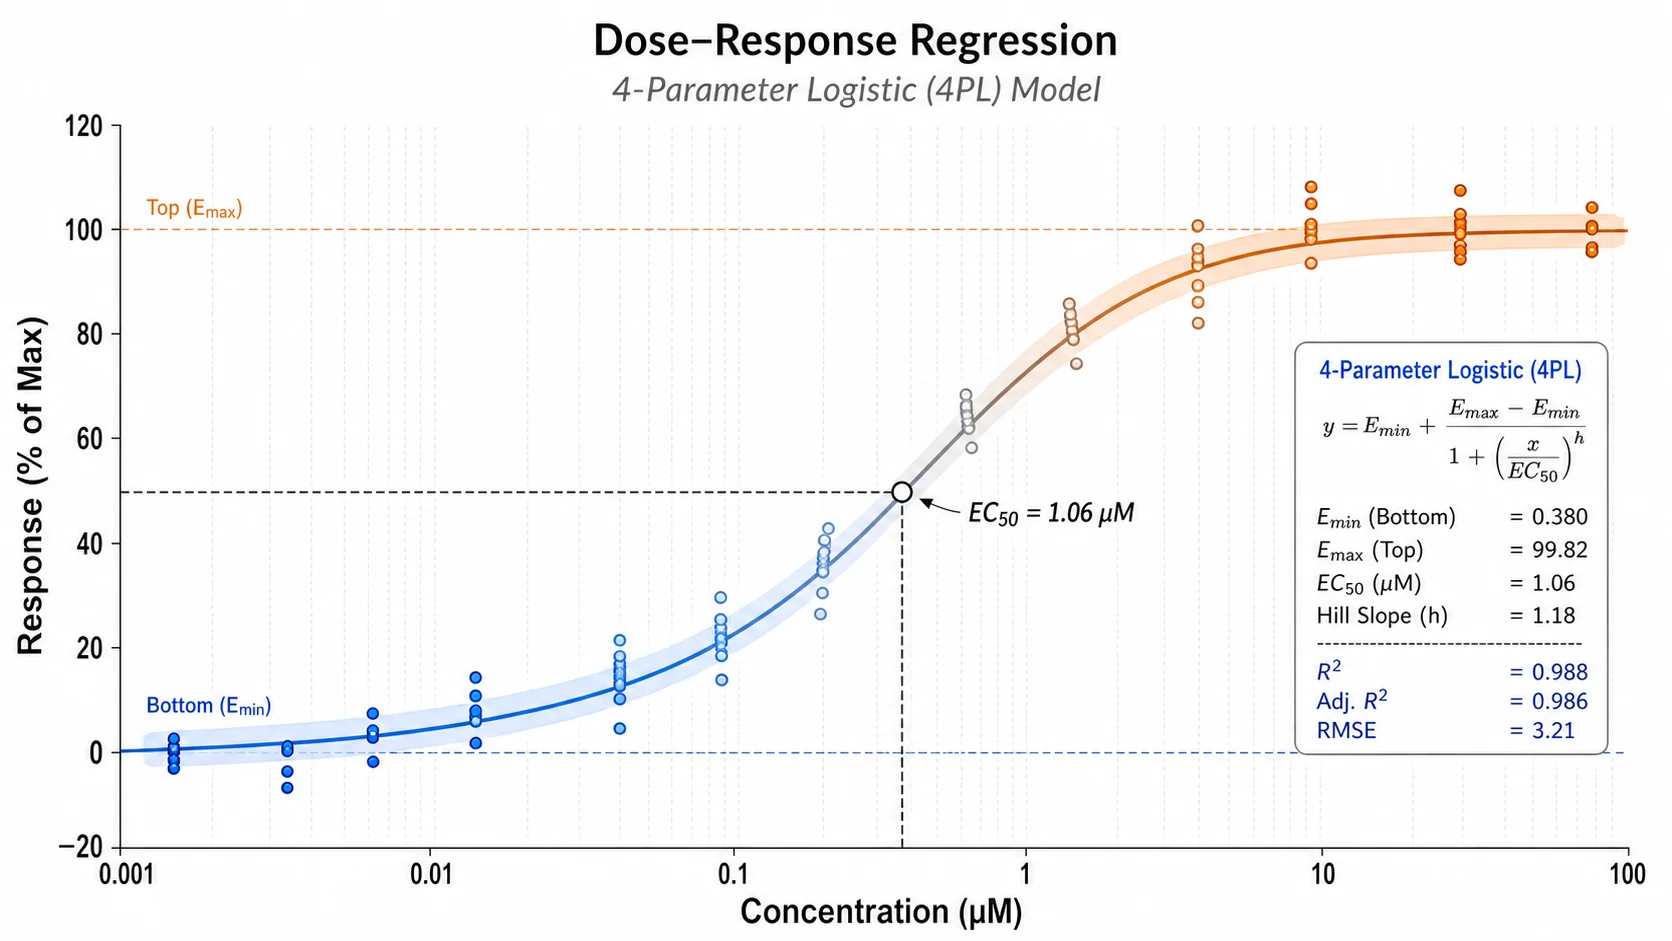
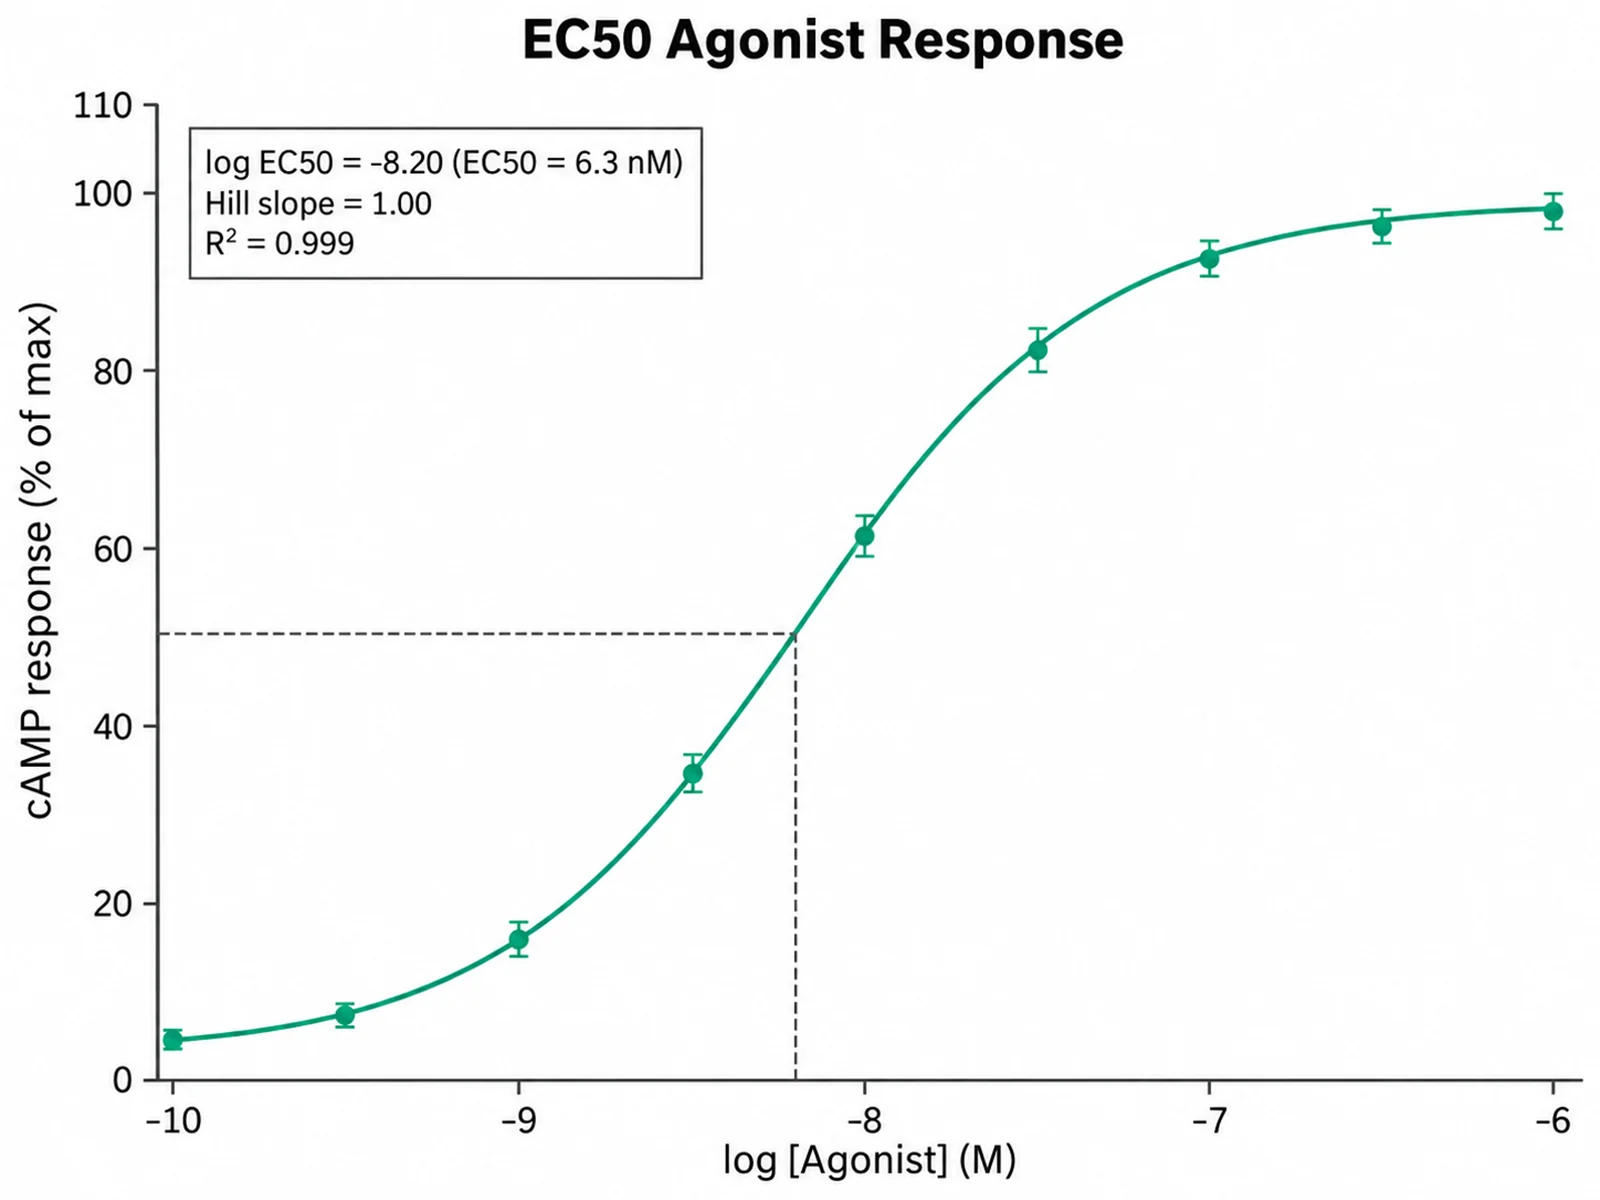
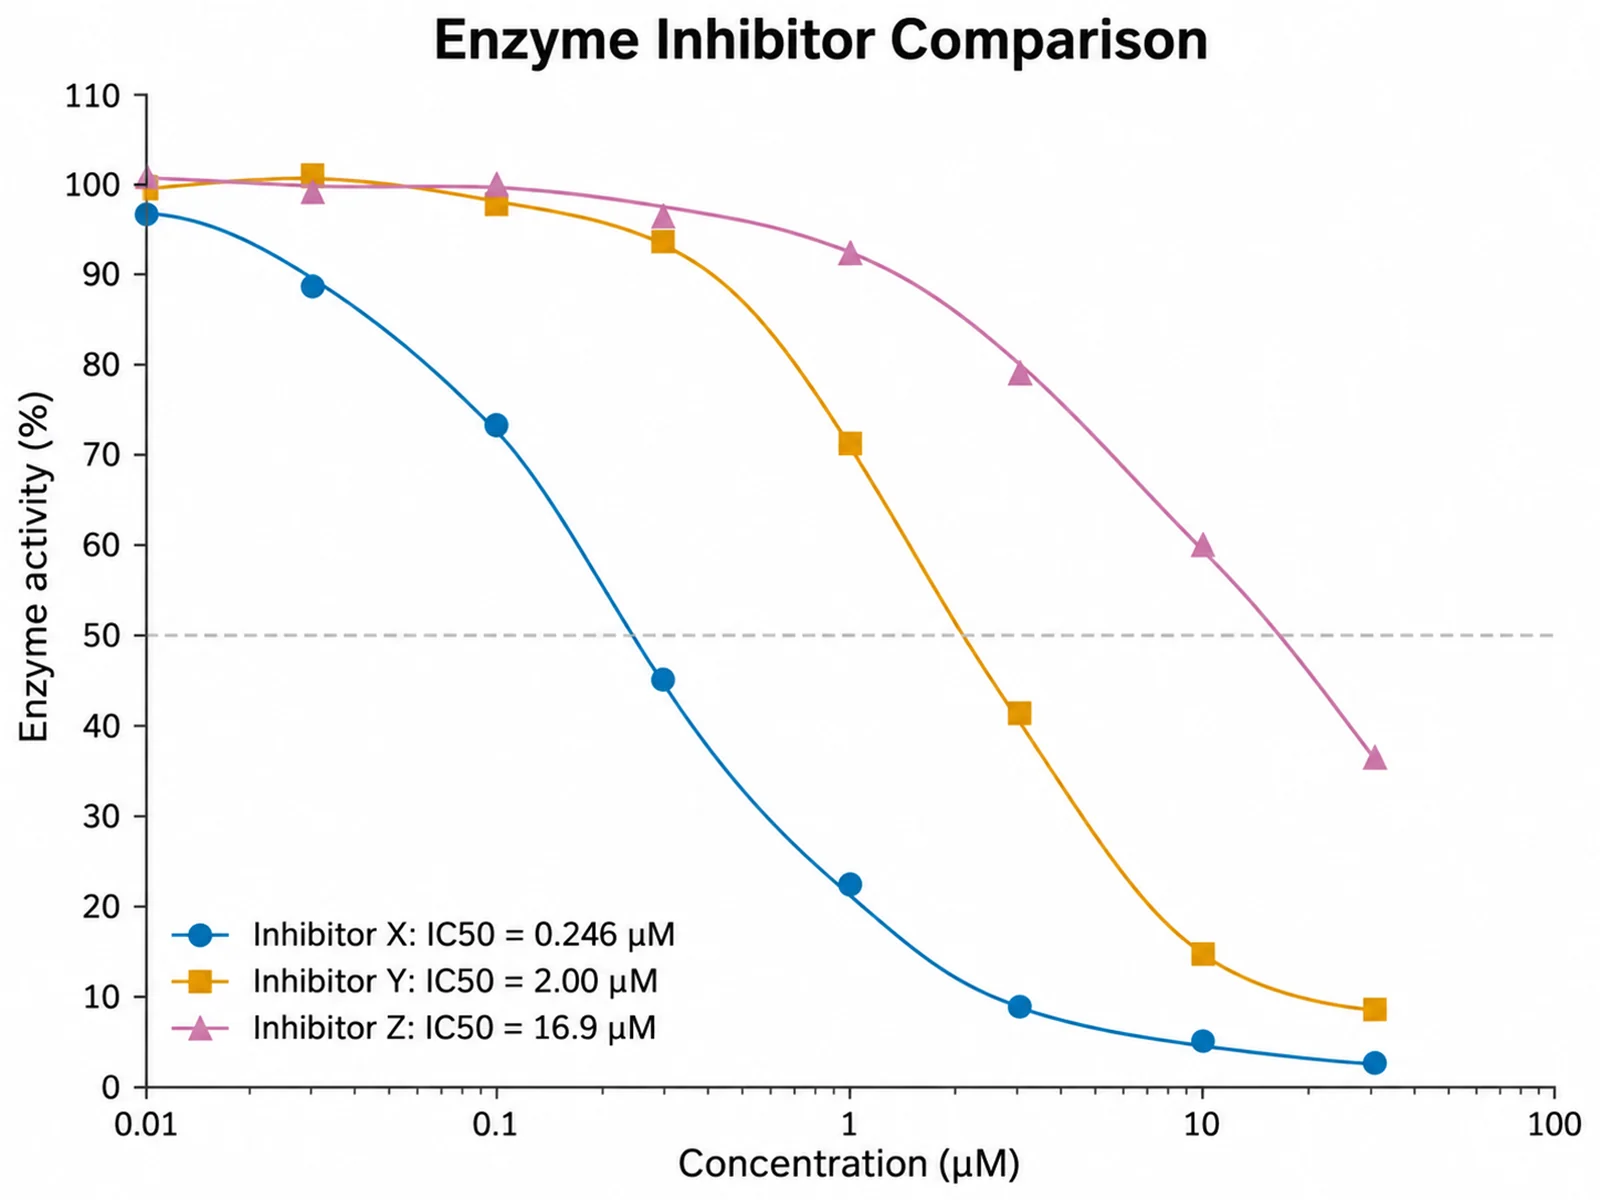
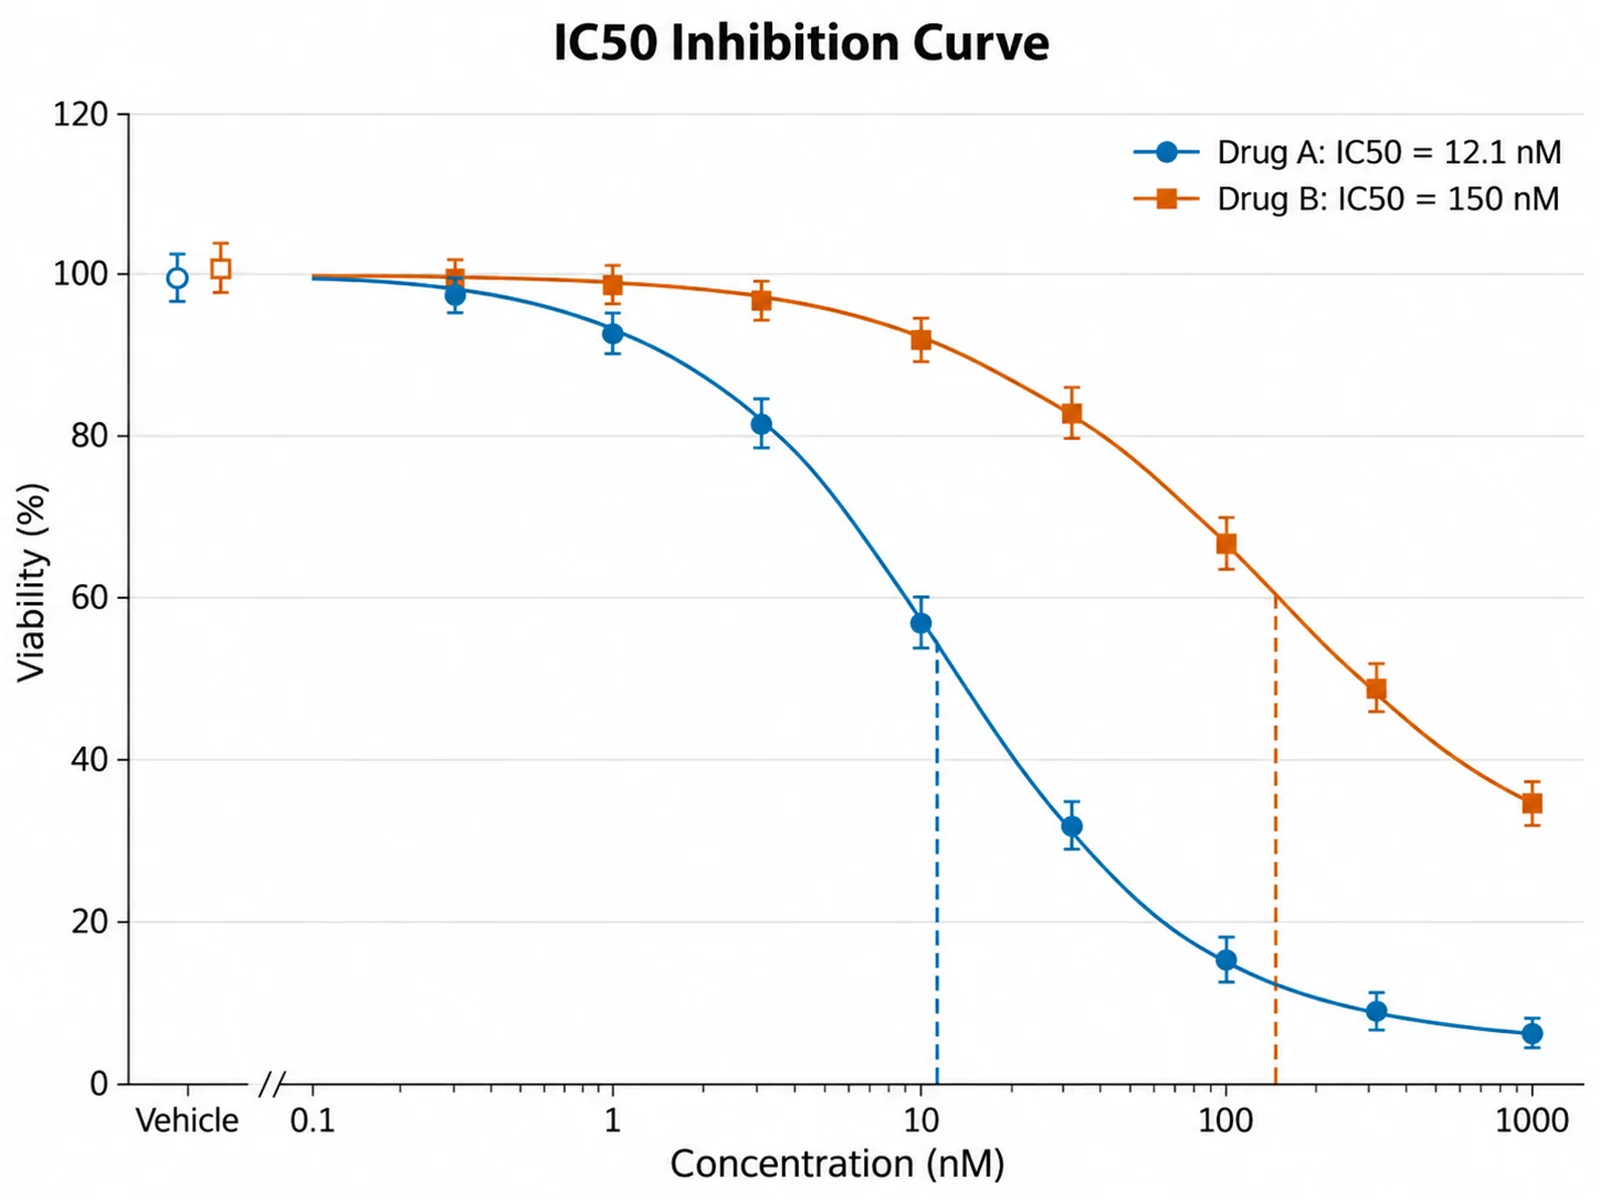
Based on the uploaded viability_assay.csv file, fit four-parameter logistic curves for Drug A and Drug B on a log10 concentration axis in nM. Show mean ± SD markers for duplicate wells, add dashed IC50 drop lines, and list each IC50 in the legend.